My question is on trying to cut off certain plots within a Plot with multiple expressions being plotted. I want to be able to stop the two dashed-line plots at their point of intersection, without affecting how the other two plots are rendered. Please see the image below:
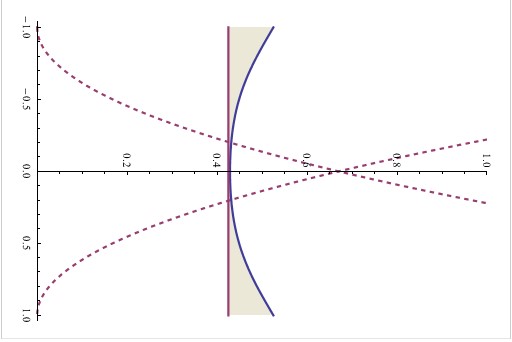
Is there a way to limit the plotting range to a certain value for some of the expressions, but not the others? Again, I want the two dashed lines to stop plotting at the point where they intersect. This image shows 4 different plots: two quadratic functions that are offset by 1 and -1, a straight line, and a parabolic function.
EDIT: Code included:
\[Lambda]1 = N[Table[(2 m - 1)/2*\[Pi], {m, 1, Nterms}]];
\[Theta][1][\[Eta]_, \[Xi]_, Nterms_] := 1 - 2 \!\(
\*UnderoverscriptBox[\(\[Sum]\), \(m = 1\), \(Nterms\)]\(
\*FractionBox[
SuperscriptBox[\((\(-1\))\), \(m +
       1\)], \(\[Lambda]1[\([\)\(m\)\(]\)]\)] Cos[\ \[Lambda]1[\([\)\
\(m\)\(]\)]*\[Eta]]*Exp[\(-4\)*
\*SuperscriptBox[\(\[Lambda]1[\([\)\(m\)\(]\)]\), \(2\)]\ \[Xi]]\)\)

Manipulate[
 Rotate[
  Plot[
   {
    a (η - 1)^2,
    a (η + 1)^2,
    xL + 0.2*θ[1][η, ξ, Nterms],
    xL
    },
   {η, -1, 1},

   PlotRange -> {0, 1},
   Filling -> {3 -> xL},
   PlotStyle ->
    {
     {Thick, Dashed, ColorData[1, 2]},
     {Thick, Dashed, ColorData[1, 2]},
     {Thick, ColorData[1, 1]},
     {Thick, ColorData[1, 2]}
    },
   AspectRatio -> 1.5
   ]
  , rotateAngle],

 {ξ, 0, 0.1},
 {xL, 0, 1},
 {{a, 1}, 0, 1},
 {{rotateAngle, -Pi/2}, {0, -Pi/2}}
 ]
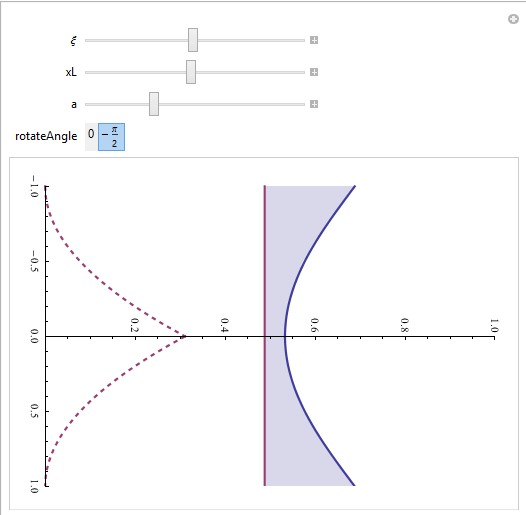
EDIT: A solution with Show and 3 Plots, but I would prefer a more elegant way to do this inside of one Plot command:
Manipulate[
 Rotate[Show[
   Plot[{a (\[Eta] - 1)^2}, {\[Eta], 0, 1},
    PlotRange -> {{-1, 1}, {0, 1}},
    PlotStyle -> {Thick, Dashed, ColorData[1, 2]}, AspectRatio -> 1.5],

   Plot[{a (\[Eta] + 1)^2}, {\[Eta], -1, 0},
    PlotRange -> {{-1, 1}, {0, 1}},
    PlotStyle -> {Thick, Dashed, ColorData[1, 2]}, AspectRatio -> 1.5],

   Plot[
    {xL + 0.2*\[Theta][1][\[Eta], \[Xi], Nterms], xL}, {\[Eta], -1, 1},
    PlotRange -> {0, 1}, Filling -> {1 -> xL},
    PlotStyle -> {{Thick, ColorData[1, 1]}, {Thick, ColorData[1, 2]}},
    AspectRatio -> 1.5]
   ], rotateAngle],

 {\[Xi], 0, 0.1},
 {xL, 0, 1},
 {{a, 1}, 0, 1},
 {{rotateAngle, -Pi/2}, {0, -Pi/2}}
 ]

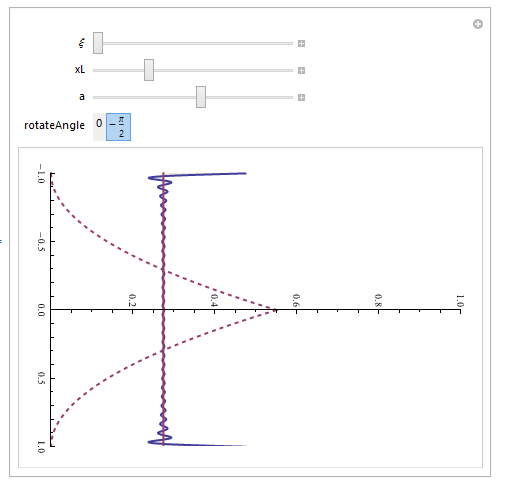
xL + 0.2*\[Theta][1][\[Eta], \[Xi], Nterms],is missing. $\endgroup$Nterms..? $\endgroup$