3
$\begingroup$

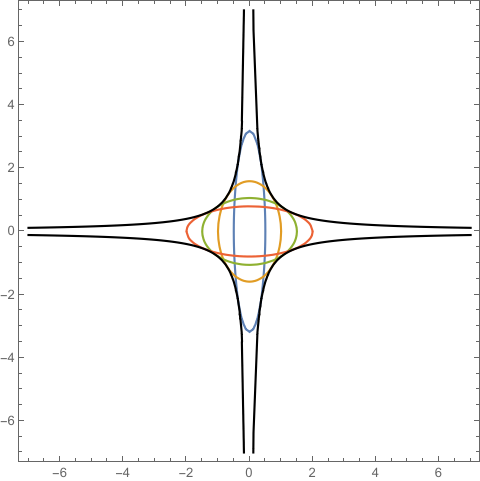
I am trying to produce a single plot, where the ellipses fits neatly within the given curve function, and with each intersecting the curve at exactly 4 points.

  • The ellipses is $x^2/a^2+y^2/b^2=1$, where $a=0.5, 0.6, 0.7, ..., 2.0$, where $a>0$,$b>0$ and $πab=5$. Hint: use Table to create all of them in one command.

  • The curve $|y|=5/(2π|x|)$, drawn in black. Be sure that the curve appears, and draw the single curve on top of the ellipses so that it is clearly visible.

What I tried to do was

Clear[x, y]
ellipse = x^2/a^2 + y^2/b^2 == 1;
curve = Abs[y] == 5/(2*Pi*Abs[x]);
ell = Table[ellipse, {a, 0.5, 2.0, 0.5}, {b, 5/Pi*a}];
curvep = ContourPlot[Evaluate[curve], {x, -7, 7}, {y, -7, 7}, 
   ContourStyle -> Black];
ellipsep = 
  ContourPlot[Evaluate[ell], {x, -7, 7}, {y, -7, 7}, 
   ContourStyle -> Rainbow];
Show[ellipsep, curvep]

but for some reason, my ellipses are not fitting inside the curve function and rather it is outside.

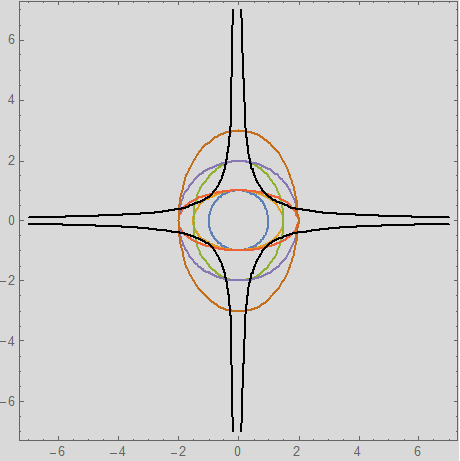
enter image description here

$\endgroup$
4
  • 1
    $\begingroup$ With[{ellipses = Table[Circle[{0, 0}, {a, 5/(a \[Pi])}], {a, 0.5, 2.0, 0.1}]}, ContourPlot[Abs[y] == 5/(2 Pi Abs[x]), {x, -7, 7}, {y, -7, 7}, Epilog -> {Opacity[.5], ellipses}, ContourStyle -> Thick] ] $\endgroup$
    – flinty
    Commented Oct 10, 2020 at 22:38
  • $\begingroup$ Can you use a different command without "With". $\endgroup$ Commented Oct 10, 2020 at 22:45
  • $\begingroup$ Why is the range for a {0.5,2.0,0.1}? where did 0.1 come from? $\endgroup$ Commented Oct 10, 2020 at 22:48
  • $\begingroup$ The requirements for ellipses are “where 𝑎=0.5,0.6,0.7,...,2.0”, which tells us that the increment between 0.5 and 0.6, and between 0.6 and 0.7, etc. is 0.1. If you use 0.5, then 𝑎=0.5,1.0,1.5,2.0 which is not what’s required. $\endgroup$
    – creidhne
    Commented Oct 10, 2020 at 23:07

1 Answer 1

4
$\begingroup$

In the equations of ellipse, replace b by 5/(Pi*a) so just one parametric say a, then it is easy to create a table ell satisfy Pi*a*b=5

Clear["`*"];
Clear[x, y]
ellipse = x^2/a^2 + y^2/b^2 == 1 /. b -> 5/(Pi*a);
curve = Abs[y] == 5/(2*Pi*Abs[x]);
ell = Table[ellipse, {a, 0.5, 2.0, 0.5}];
curvep = ContourPlot[Evaluate[curve], {x, -7, 7}, {y, -7, 7}, 
   ContourStyle -> Black];
ellipsep = 
  ContourPlot[Evaluate[ell], {x, -7, 7}, {y, -7, 7}];
Show[ellipsep, curvep]

enter image description here

$\endgroup$

Your Answer

By clicking “Post Your Answer”, you agree to our terms of service and acknowledge you have read our privacy policy.

Not the answer you're looking for? Browse other questions tagged or ask your own question.