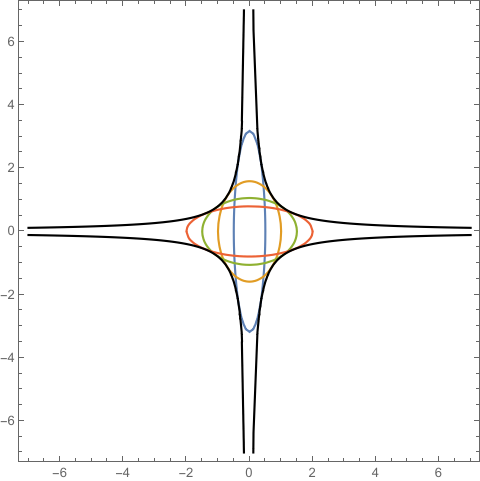
I am trying to produce a single plot, where the ellipses fits neatly within the given curve function, and with each intersecting the curve at exactly 4 points.
The ellipses is $x^2/a^2+y^2/b^2=1$, where $a=0.5, 0.6, 0.7, ..., 2.0$, where $a>0$,$b>0$ and $πab=5$. Hint: use Table to create all of them in one command.
The curve $|y|=5/(2π|x|)$, drawn in black. Be sure that the curve appears, and draw the single curve on top of the ellipses so that it is clearly visible.
What I tried to do was
Clear[x, y]
ellipse = x^2/a^2 + y^2/b^2 == 1;
curve = Abs[y] == 5/(2*Pi*Abs[x]);
ell = Table[ellipse, {a, 0.5, 2.0, 0.5}, {b, 5/Pi*a}];
curvep = ContourPlot[Evaluate[curve], {x, -7, 7}, {y, -7, 7},
   ContourStyle -> Black];
ellipsep =
  ContourPlot[Evaluate[ell], {x, -7, 7}, {y, -7, 7},
   ContourStyle -> Rainbow];
Show[ellipsep, curvep]
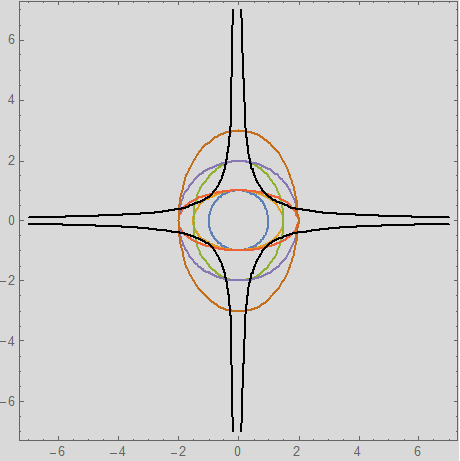
but for some reason, my ellipses are not fitting inside the curve function and rather it is outside.


With[{ellipses = Table[Circle[{0, 0}, {a, 5/(a \[Pi])}], {a, 0.5, 2.0, 0.1}]}, ContourPlot[Abs[y] == 5/(2 Pi Abs[x]), {x, -7, 7}, {y, -7, 7}, Epilog -> {Opacity[.5], ellipses}, ContourStyle -> Thick] ]$\endgroup$