39
$\begingroup$

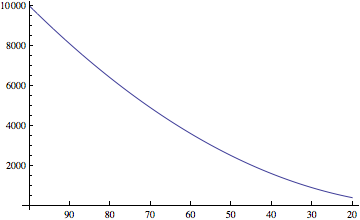
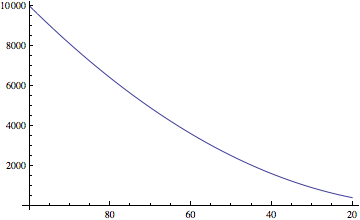
I want to make a 2D plot where the x-axis is flipped so the higher numbers are on the right and lower numbers are on the left.

I've managed to do it by flipping the data and making new Ticks but this solution is manually and requires manipulating the data. I was hoping there was a better way.

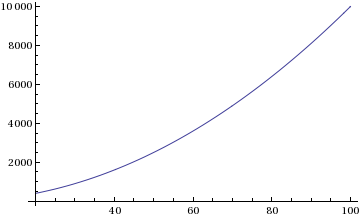
For the normal plot:

data = Table[{x, x^2}, {x, 20, 100}];
ListLinePlot[data]

Mathematica graphics

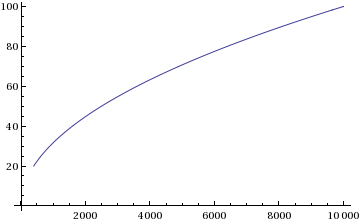
And for the flipped data and the new plot:

data = Table[{100 - x + 20, x^2}, {x, 20, 100}];
ticks = Table[{x, 100 - x + 20}, {x, 20, 100, 10}]
ListLinePlot[data, Ticks -> {ticks, Automatic}]

Mathematica graphics

I couldn't seem to find any options like ReverseAxis.

$\endgroup$
4

6 Answers 6

47
$\begingroup$

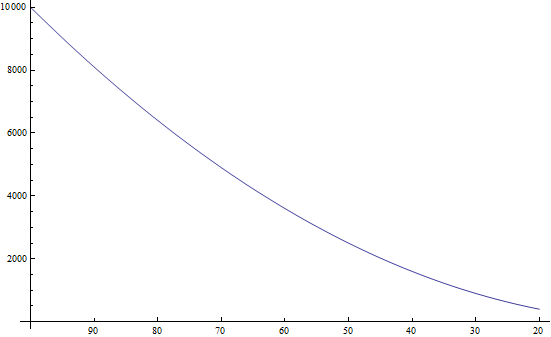
@Mr. Wizard pointed to a thread that mentioned the option ScalingFunctions which works for BarChart and Histogram according to the documentation and supports a Reverse option.

I simply tried this with ListLinePlot and although the ScalingFunctions appears in red, it works!

ListLinePlot[data, ScalingFunctions -> {"Reverse", Identity}]

Mathematica graphics

Thanks @Mr. Wizard and undocumented magic functions!

$\endgroup$
7
  • 1
    $\begingroup$ It is of note that this does not work in version 7. Good find for v8 users! $\endgroup$
    – Mr.Wizard
    Commented May 18, 2012 at 14:34
  • 3
    $\begingroup$ Unfortunately this does not work with DateListPlot, but it does work with ListPlot/ListLinePlot. As well as "Reverse", "Log" and "Log10" seem to work. $\endgroup$
    – Verbeia
    Commented May 23, 2012 at 3:44
  • $\begingroup$ Good find! Sometimes you just have to outsmart the manual. $\endgroup$ Commented Jun 30, 2012 at 10:02
  • $\begingroup$ @Mr.Wizard Does this work in version 9? $\endgroup$
    – Simon
    Commented Sep 9, 2014 at 7:29
  • 1
    $\begingroup$ lifesaver! thanks! still works in 11.3 $\endgroup$ Commented Jan 10, 2022 at 20:25
16
$\begingroup$

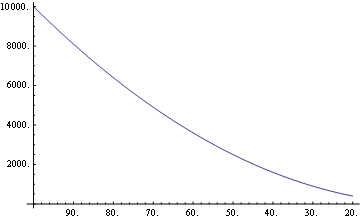
Here is a bit different solution

d = Transpose@data;
ListLinePlot[ Transpose@{Reverse@d[[1]], d[[2]]}, 
              Ticks -> {Transpose@{Range[20, 100, 10], Range[100, 20, -10]}, Automatic}]

enter image description here

If we don't like to specify in advance ranges of ticks, here is another, more general approach :

ListLinePlot[ Transpose @ { Reverse@ d[[1]], d[[2]]}, 
              Ticks -> {Transpose @ { Range[ Min[#], Max[#], 
                                     10^(Ceiling@Log[10, (Max[#] - Min[#])] - 1)] &@d[[1]], 
                                     Range[Max[#], Min[#], 
                                     -10^(Ceiling@Log[10, (Max[#] - Min[#])] - 1)] & @ d[[1]]},
                                      Automatic}]
$\endgroup$
5
  • $\begingroup$ @belisarius I was mislead by two different definitions of data in the OP question. So I had to update my earlier answer. $\endgroup$
    – Artes
    Commented May 18, 2012 at 18:05
  • $\begingroup$ I imagined that, and posted my comment so that you could come with a different answer. Well done +1 $\endgroup$ Commented May 18, 2012 at 22:40
  • $\begingroup$ @belisarius Thanks for an upvote. I don't understand your approach. The plot in your post seems to be ok, but when I applied your solution to the first definition of data in the OP question the ticks on the x axes are not reversed. How do I get what the OP wanted ? $\endgroup$
    – Artes
    Commented May 18, 2012 at 22:58
  • $\begingroup$ Something got tangled (probably some neurons) when I pasted the code here. Thanks for the warning! Try the code now $\endgroup$ Commented May 18, 2012 at 23:24
  • $\begingroup$ @belisarius Now it works +1. $\endgroup$
    – Artes
    Commented May 18, 2012 at 23:27
9
$\begingroup$

For flipping the axes I use the following function:

Options[flippeAchsen] = Union[{Achsen -> 1}, Options[Graphics]];
flippeAchsen[pp_Graphics, opts : OptionsPattern[]] := 
 Module[{tx, ty, labx, laby, GAPx, GAPy, qq, xyRule, x, y, achs, 
   TICKS, ticks, gropts, frame, FTall}, achs = OptionValue[Achsen];
  If[achs > 3, FTall = True; achs = Mod[achs, 3, 1], FTall = False];
  frame = OptionValue[Frame];
  TICKS = If[frame === True, FrameTicks, Ticks];
  gropts = Sequence @@ FilterRules[Flatten[{opts}], Options[Graphics]];
  tx = AbsoluteOptions[pp, TICKS][[1, 2, 1]];
  ty = AbsoluteOptions[pp, TICKS][[1, 2, 2]];
  labx = Select[Flatten[Cases[tx, {n_, l_, rest__}]], NumericQ];
  laby = Select[Flatten[Cases[ty, {n_, l_, rest__}]], NumericQ];
  GAPx = Max[labx] - Min[labx];
  GAPy = Max[laby] - Min[laby];
  Which[achs == 1,(*x Achse*)
   xyRule = {x_?NumericQ, y_?NumericQ} -> {GAPx - x, y};
   ticks = {Map[{GAPx - First[#], Sequence @@ Rest[#]} &, tx], ty}, 
   achs == 2,(*y Achse*)
   xyRule = {x_?NumericQ, y_?NumericQ} -> {x, GAPy - y};
   ticks = {tx, Map[{GAPy - First[#], Sequence @@ Rest[#]} &, ty]}, 
   achs == 3,(*beide Achsen*)
   xyRule = {x_?NumericQ, y_?NumericQ} -> {GAPx - x, GAPy - y};
   ticks = {Map[{GAPx - First[#], Sequence @@ Rest[#]} &, tx], 
     Map[{GAPy - First[#], Sequence @@ Rest[#]} &, ty]}];
  ticks = 
   If[frame === True, 
    If[FTall === 
      True, {{ticks[[2]], ticks[[2]]}, {ticks[[1]], 
       ticks[[1]]}}, {{ticks[[2]], None}, {ticks[[1]], None}}], ticks];
  Show[pp /. xyRule, Evaluate[gropts], Axes -> True, PlotRange -> All,
    AxesOrigin -> AbsoluteOptions[pp, AxesOrigin][[1, 2]] /. xyRule, 
   TICKS -> ticks]]

The option Achsen choses the axes to flip:

Achsen->1 reverts the first (x-axis)
Achsen->2 reverts the second (y-axis
Achsen->3 reverts both

If you use FrameTicks you must pass this option to flippeAchsen too.
In frames the ticks are drawn bottom and left by default. If one want the Ticks on all four sides, just add 3 to the option Achsen.

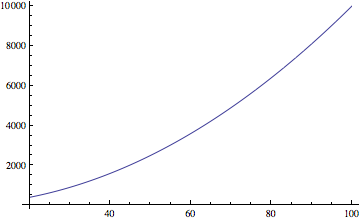
Call is: flippeAchsen[plot, Achsen->number]
$\endgroup$
3
  • $\begingroup$ Thanks it works, however, when I run flippeAchsen[ListLinePlot[data, AxesOrigin -> {100, 0}], Achsen -> 1] I get a few errors OptionValue::nodef: Unknown option Achsen for flippeAchsen. >> $\endgroup$
    – s0rce
    Commented May 18, 2012 at 13:29
  • 1
    $\begingroup$ @s0rce For me it works. Did you copy the first Line of the code Options[flippeAchsen]=Union... ? $\endgroup$ Commented May 18, 2012 at 13:38
  • $\begingroup$ nope, I missed it. Thanks, it works now! $\endgroup$
    – s0rce
    Commented May 18, 2012 at 13:50
9
$\begingroup$

Mike Honeychurch wrote a package ReverseListPlot that does this; it's available on MathSource.

$\endgroup$
4
$\begingroup$

Probably can be simplified:

k1 = Transpose@({Reverse[#[[1]]], #[[2]]} &@Transpose@data);
ListLinePlot[k1, 
 Ticks -> ({Transpose[({#[[1]], Reverse@#[[2]], #[[3]], #[[4]]} &@
           Transpose[Sort@#[[1, 2, 1]]])], #[[1, 2, 2]]} &@
                                                    AbsoluteOptions[ListLinePlot@k1, Ticks])]

enter image description here

$\endgroup$
1
$\begingroup$

You may use the following commands:

g = Plot[x^2, {x, 20, 100}]

Mathematica graphics

Show[g /. x_Line :> Reverse[x, 3], PlotRange -> Automatic]

Mathematica graphics

$\endgroup$
2
  • 3
    $\begingroup$ I'm afraid that it doesn't show the same output as the other answers. $\endgroup$
    – Öskå
    Commented May 25, 2014 at 10:48
  • $\begingroup$ The question is about flipping the y-axis values, not exchanging them with the x-axis. $\endgroup$ Commented May 25, 2014 at 13:02

Your Answer

By clicking “Post Your Answer”, you agree to our terms of service and acknowledge you have read our privacy policy.

Not the answer you're looking for? Browse other questions tagged or ask your own question.