1
$\begingroup$

I can use Tooltip to show the value of each element in a ListPlot:

ListPlot[Table[Tooltip[a = Random[], a], {i, 1, 100}]]

but applied to QuantilePlot,

QuantilePlot[Table[Tooltip[a = Random[], a], {i, 1, 100}]] 

one gets a error message

QuantilePlot::ldata: 0.3164278757335126` is not a valid dataset, distribution, or a valid list of datasets and distributions.

and the return is not a plot but

QuantilePlot[{<numbers with tooltip when hovered over by mouse>}]

How can I work around this? I think it's a bug.

$\endgroup$
0

2 Answers 2

2
$\begingroup$

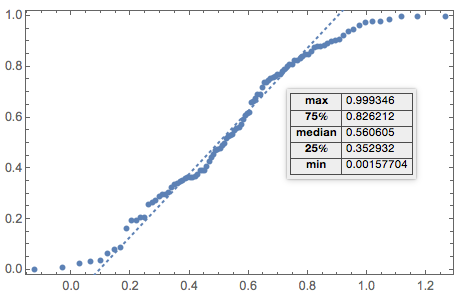
What you are encountering is not a bug. You are misinterpreting the QuantilePlot documentation. Tooltip can only be applied to the data as a whole, not to individual elements of the data (unless you do some post-processing of the plot as kuba suggests).

Thus

SeedRandom[42]; QuantilePlot[Tooltip @ RandomReal[1., 100]]

works fine and gives

plot

$\endgroup$
1
  • $\begingroup$ The values shown in the Tooltip are consistent with Dataset@Association@ Thread[{"max", "75%", "median", "25%", "min"} -> Quantile[data, Range[1, 0, -1/4]]] but the values differ from those provided by Quartiles[data] or Median[data]. It is not clear why the Quantile method is used rather than the "Quartile` method since quartiles are being displayed. $\endgroup$
    – Bob Hanlon
    Commented Mar 18, 2018 at 16:40
1
$\begingroup$
data = RandomVariate[UniformDistribution[{0, 1}], 100]

QuantilePlot[data] /. Point[pos_] :> (Tooltip[Point[#], #] & /@ pos)
$\endgroup$
2
  • $\begingroup$ Excellent, thank you! $\endgroup$
    – qwerty
    Commented Oct 14, 2015 at 17:11
  • $\begingroup$ @qwerty I'm glad it fits your needs. Please take a tour $\endgroup$
    – Kuba
    Commented Oct 18, 2015 at 13:47

Your Answer

By clicking “Post Your Answer”, you agree to our terms of service and acknowledge you have read our privacy policy.

Not the answer you're looking for? Browse other questions tagged or ask your own question.