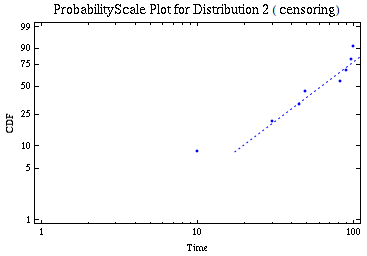
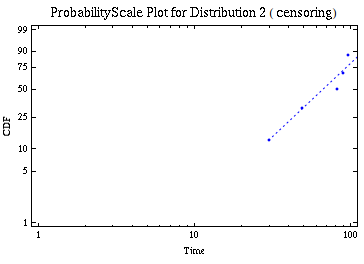
I am trying to reproduce a ProbabilityScalePlot of censored data shown here (see Sample Analysis Plot). Here is my Mathematica code. First I deal with the uncensored case.
probscaleplotFix =
Graphics[Append[First@#, Epilog /. Options[#, Epilog]],
FilterRules[Options[#], Except[Epilog]]] &;
SetOptions[ProbabilityScalePlot,
DisplayFunction ->
probscaleplotFix]; (* Needed to fix a software bug, see solution \
by Alexey Popkov on StackExchange *)

data = {30, 49, 82, 90, 96};
distA = EstimatedDistribution[data,
WeibullDistribution[a, b], {{a, 3}, {b, 50}}]
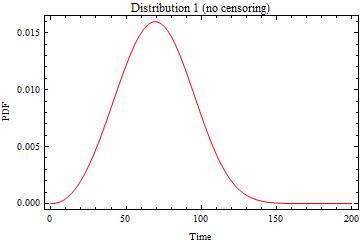
plot1 = Plot[PDF[distA, t], {t, 0, 200}, Frame -> True,
FrameLabel -> {"Time", "PDF"},
PlotLabel -> "Distribution 1 (no censoring)", PlotRange -> All,
PlotStyle -> Red]
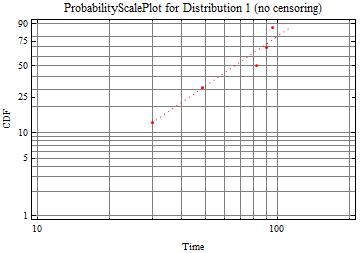
plot2 = ProbabilityScalePlot[data, "Weibull",
PlotRange -> {{10, 200}, {1, 90}}, PlotStyle -> Red, Frame -> True,
FrameLabel -> {"Time", "CDF"},
PlotLabel ->
"ProbabilityScalePlot for Distribution 1 (no censoring)",
GridLines -> Automatic]
So far so good . . . now for the censored data.
eventdata =
EventData[{30, 49, 82, 90, 96, 10, 45, 100}, {None, None, None, None,
None, Right, Right, Right}]

dist2 = EstimatedDistribution[eventdata,
WeibullDistribution[a2, b2], {{a2, 3}, {b2, 50}}]

plot3 = Plot[PDF[dist2, t], {t, 0, 200}, Frame -> True,
FrameLabel -> {"Time", "PDF"},
PlotLabel -> "Distribution 2 (censoring)", PlotRange -> All]
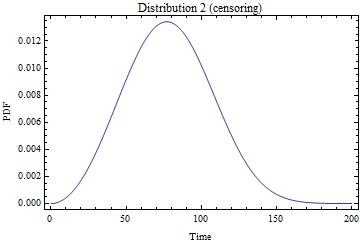
plot4 = ProbabilityScalePlot[dist2, "Weibull",
PlotRange -> {{1, 100}, {1, 99}}, PlotStyle -> Blue, Frame -> True,
FrameLabel -> {"Time", "CDF"},
PlotLabel -> "ProbabilityScale Plot for Distribution 2 (censoring)"]
ProbabilityScalePlot::estmd: Unable to estimate a reference distribution from the data. >>
plot5 = ProbabilityScalePlot[eventdata, "Weibull",
PlotRange -> {{1, 100}, {1, 99}}, PlotStyle -> Blue, Frame -> True,
FrameLabel -> {"Time", "CDF"},
PlotLabel -> "ProbabilityScale Plot for Distribution 2 (censoring)"]
ProbabilityScalePlot::ldata: EventData[8] is not a valid dataset, distribution, or a valid list of datasets and distributions. >>
Can someone tell me how to produce the ProbabilityScalePlot for either eventdata or dist2 ?
Many Thanks.

