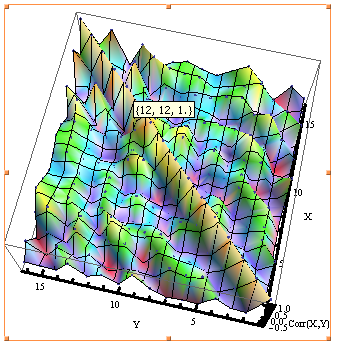
I am getting stuck with figuring out how to use Tooltip for a ListPlot3D.
Basically I have a list of values for the 3D plot (no table or function)
and would like to have the Tooltip return the x, y and z coordinates for the
point.
Here is the code for the Plot that I would like to have "tooltipped":
correlationMatrix = {{1., -0.312997, -0.23282,
  0.21541, -0.492404, -0.429369, -0.529716, -0.139237,
  0.545136, -0.329623, 0.0439952, -0.281572,
  0.311432, -0.339743, -0.313293, -0.276101}, {-0.312997, 1.,
  0.124945, -0.40165, 0.346201, 0.202914,
  0.422802, -0.330172, -0.255637, -0.312864, -0.669181,
  0.148235, -0.26647, 0.171766, -0.529144, 0.0928761}, {-0.23282,
  0.124945, 1., 0.117204, -0.284851, -0.0106801, 0.132487,
  0.266604, -0.612488, 0.276884, 0.194778, -0.169994,
  0.508427, -0.430038, -0.0587014, -0.646482}, {0.21541, -0.40165,
  0.117204, 1., -0.139717, -0.264258, -0.391223, 0.311072, 0.222882,
  0.219147, 0.702512, -0.454245, 0.342072, -0.22791, 0.473594,
  0.0226572}, {-0.492404, 0.346201, -0.284851, -0.139717, 1.,
  0.382168, 0.351843, -0.454952, -0.0969759, -0.234836, -0.355201,
  0.169766, -0.190264, 0.337011, 0.264028, 0.509604}, {-0.429369,
  0.202914, -0.0106801, -0.264258, 0.382168,
  1., -0.24091, -0.279989, -0.0826109, 0.370576, -0.102702,
  0.229024, -0.366183, 0.265442, 0.0947463, 0.225124}, {-0.529716,
  0.422802, 0.132487, -0.391223, 0.351843, -0.24091,
  1., -0.178734, -0.520441, -0.252357, -0.396323, 0.191239, -0.104731,
   0.0866192, -0.0556171, -0.0804755}, {-0.139237, -0.330172,
  0.266604, 0.311072, -0.454952, -0.279989, -0.178734, 1., -0.050751,
  0.659989, 0.515793, 0.0467429, 0.0373106, 0.0889927, 0.257039,
  0.0444238}, {0.545136, -0.255637, -0.612488,
  0.222882, -0.0969759, -0.0826109, -0.520441, -0.050751,
  1., -0.0912518, 0.304593, -0.29235, -0.398841, -0.093443, 0.272338,
  0.225868}, {-0.329623, -0.312864, 0.276884, 0.219147, -0.234836,
  0.370576, -0.252357, 0.659989, -0.0912518, 1., 0.539342,
  0.113201, -0.0615683, 0.133768, 0.362695,
  0.0785236}, {0.0439952, -0.669181, 0.194778,
  0.702512, -0.355201, -0.102702, -0.396323, 0.515793, 0.304593,
  0.539342, 1., -0.573185, 0.0920204, -0.456162,
  0.678595, -0.221534}, {-0.281572, 0.148235, -0.169994, -0.454245,
  0.169766, 0.229024, 0.191239, 0.0467429, -0.29235,
  0.113201, -0.573185, 1., -0.20389, 0.891105, -0.119537,
  0.520205}, {0.311432, -0.26647, 0.508427,
  0.342072, -0.190264, -0.366183, -0.104731,
  0.0373106, -0.398841, -0.0615683, 0.0920204, -0.20389,
  1., -0.368594, -0.205337, -0.353868}, {-0.339743,
  0.171766, -0.430038, -0.22791, 0.337011, 0.265442, 0.0866192,
  0.0889927, -0.093443, 0.133768, -0.456162, 0.891105, -0.368594, 1.,
  0.0188257, 0.824432}, {-0.313293, -0.529144, -0.0587014, 0.473594,
  0.264028, 0.0947463, -0.0556171, 0.257039, 0.272338, 0.362695,
  0.678595, -0.119537, -0.205337, 0.0188257, 1.,
  0.187089}, {-0.276101, 0.0928761, -0.646482, 0.0226572, 0.509604,
  0.225124, -0.0804755, 0.0444238, 0.225868, 0.0785236, -0.221534,
  0.520205, -0.353868, 0.824432, 0.187089, 1.}};

ListPlot3D[correlationMatrix, AxesStyle -> Thickness[0.01],
 AxesLabel -> {"X", "Y", "Corr(X,Y)"},
 AxesEdge -> {{-1, -1}, {-1, -1}, {-1, -1}},
 ColorFunction -> "BrightBands"]


ListPlot3Dwithout a table? Could you provide a simple code example of what you mean to do? $\endgroup$