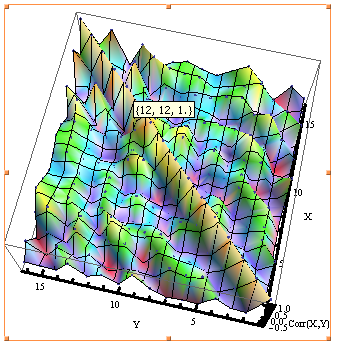
Show[ListPlot3D[CorrelationMatrixShow[
  ListPlot3D[correlationMatrix,
    AxesStyle -> Thickness[0.01],
                AxesLabel -> {"X", "Y", "Corr(X,Y)"},
                AxesEdge -> {{-1, -1}, {-1, -1}, {-1, -1}},
                ColorFunction -> "BrightBands"],
    ListPointPlot3D@
       ListPointPlot3D @ Tooltip @ Flatten[
    Tooltip@Flatten[MapIndexed[Flatten@MapIndexed[Flatten@{#2, #1} &, CorrelationMatrixcorrelationMatrix, {2}], 1]]1]
]

