4
$\begingroup$

I have a contour plot and I would like to have finer control over the tooltips that are displayed.

For the sake of argument, suppose that I have the following plot,

ContourPlot[
 Exp[-x^2 - y^2]
 , {x, 0, 2}, {y, 0, 2}
 , PlotRange -> Full
 , Contours -> 10^Range[-4, 0, 0.1]
 ]
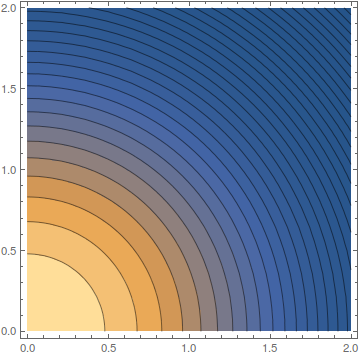
Mathematica graphics

and I would like to force scientific notation on the tooltips - say, I'd like every tooltip in the form $10^{-3.7}$. More generally, I would like to apply a user-supplied function tooltipFunction to the value F[x,y] of the plotted function at the contour and display this as the tooltip.

The documentation for ContourLabels hints that this should be possible, via a specification of the form

ContourLabels->{f,g} uses f[x,y,z] as an explicit displayed label, and uses g[x,y,z] as a tooltip for each complete contour line.

However, there are no examples on the documentation and naive implementations of this don't seem to work.

Is there any way to implement this, preferably within the confines of the ContourPlot call?

$\endgroup$

3 Answers 3

5
$\begingroup$

Here is what I think is going on with the second argument to ContourLabel.

Everything starts with the fact that ContourPlot has Attribute of HoldAll, which means that all the options you give it can be parsed in a non-standard way before being evaluated.

This seems to be happening in the ContourLabels option: it is scanned for the appearance of Tooltip, and apparently also for a slot #2. But all other slots such as #1 or #3 are unused. In other words, the first argument of Tooltip in the ContourLabel option could equally be replaced by # or Null or blah, because the held form of Tooltip that is given in the option is parsed in such a way that its first argument is always taken as the slot into which the contour line is later inserted, no matter what you put in at the time when you specify it as an option.

To see that ContourPlot parses its ContourLabel option in this non-standard way, one can try this:

Clear[blah];
ContourPlot[Exp[-x^2 - y^2], {x, 0, 2}, {y, 0, 2}, PlotRange -> Full, 
 Contours -> 10^Range[-4, 0, 0.1], 
 ContourLabels -> {None, 
   Tooltip[blah, DisplayForm[SuperscriptBox[10, Log[10, #2]]]] &}]

tooltip

So the content of the first argument to Tooltip is simply discarded when provided as an option in ContourPlot, and only #2 has any meaning.

This non-standard parsing of the held expression would also explain why you cannot obtain the same result by specifying

labelFunction = Function[{x, y},
   Tooltip[x, DisplayForm[SuperscriptBox[10, Log[10, y]]]]];

and then using the option

ContourLabels -> {None, labelFunction}

in ContourPlot. There is no literal Tooltip appearing in the held expression passed as an option, and as a result Mathematica doesn't plot any contour tooltips with this approach, despite the fact that Function would normally be an admissible replacement for the & construct that was used above.

$\endgroup$
2
  • $\begingroup$ Oh, OK - the HoldAll argument makes sense. Bizarre choice of syntax, overall, on multiple counts. $\endgroup$ Commented May 26, 2015 at 0:02
  • $\begingroup$ Thank you for chiming in on this. I am still a bit confused as to how the innards of ContourPlot check for the literal presence of Tooltip. Head[expression] == Tooltip? $\endgroup$
    – MarcoB
    Commented May 26, 2015 at 5:04
4
$\begingroup$

Hat-tip to DrMajorBob for this handy workaround:

ContourPlot[
  Exp[-x^2 - y^2]
  , {x, 0, 2}, {y, 0, 2}
  , PlotRange -> Full
  , Contours -> 10^Range[-4, 0, 0.1]
  ] /. {Tooltip[expr_, tooltip_] :> Tooltip[expr, 
         DisplayForm[SuperscriptBox[10, Log[10, tooltip]]]
     ]}

This uses the fact that Tooltip'd expressions have a very distinctive form, and therefore make very easy targets for the pattern matcher.

More generally, the replacement rule

/. {Tooltip[expr_, tooltip_] :> Tooltip[expr, tooltipFunction[tooltip]]}

will apply tooltipFunction to the label of any Tooltip in the expression to its left.

However, it would still be nice to have some insight into how ContourLabels is meant to work in this context.

$\endgroup$
4
  • $\begingroup$ There's a Log10[] function, but MantissaExponent[] might be a better choice here. $\endgroup$ Commented May 25, 2015 at 20:46
  • 1
    $\begingroup$ @Guesswhoitis. I'm not interested so much in the actual handling of tooltip by that replacement rule as in understanding how I can deploy a tooltipFunction to change its value. $\endgroup$ Commented May 25, 2015 at 20:54
  • $\begingroup$ I know. :) Since you mentioned scientific notation, I just made a note on how to construct it. (I'll upvote when I can again.) $\endgroup$ Commented May 25, 2015 at 21:00
  • $\begingroup$ In this specific case it was intentional - this form makes the log scale much easier to parse. For full scientific notation, I know there are better tools ;). $\endgroup$ Commented May 25, 2015 at 21:01
4
$\begingroup$

The solution below seems to work for me from within ContourPlot, using the ContourLabels option:

ContourPlot[
 Exp[-x^2 - y^2],
 {x, 0, 2}, {y, 0, 2},
 PlotRange -> Full,
 Contours -> 10^Range[-4, 0, 0.1],
 ContourLabels -> {None, Tooltip[#3, DisplayForm[SuperscriptBox[10, Log[10, #2]]]] &}
]

Plot with custom contour tooltips

The key piece of information is the fact that the g function referred to in the documentation to ContourLabels must itself be a Tooltip function, and not an argument for Tooltip as the documentation seems to suggest. I stumbled across this nugget some time ago in an excellent answer by Jens on this site.

$\endgroup$
5
  • $\begingroup$ Huh. Can you comment on arguments are given to g? The obvious diagnosis is ContourLabels -> {None, Tooltip[#3, {#1, #2, #3}] &} but it produces tooltips of the form {#1, 0.125893, #3}, which completely stumps me. How can #2 return something while #1 doesn't? Since #3 does not return anything, does it matter what's in the first argument of g's Tooltip call? No wonder this had people stumped. $\endgroup$ Commented May 25, 2015 at 17:51
  • $\begingroup$ @episanty Unfortunately, that part baffles me as well. Essentially, I used trial-and-error to choose the argument to g. The documentation is impressively unhelpful on this point. My best guess at this point is that g may be passed the contour line itself as #3, and the contour value as #2, so not $(x,y,z)$ values as suggested by the docs, but I still don't know for sure! $\endgroup$
    – MarcoB
    Commented May 25, 2015 at 17:56
  • $\begingroup$ From what I can tell, (i) g is only passed the value of the contour, as its second argument, and (ii) the first Tooltip argument is never touched. It seems this can be anything and the tooltips will display. For an interesting twist, try ContourLabels -> {None, Tooltip[Print["bingo"], {#1, #2, #3}] &}. Moreover, neither of ContourLabels -> {None, Tooltip[, {##}] &} or ContourLabels -> {None, Tooltip[, {##2}] &} produce anything sensible. Bizarre. $\endgroup$ Commented May 25, 2015 at 18:00
  • $\begingroup$ @episanty Yes, I was also trying to "catch" the value of the parameters passed to g with Print, but I could make no sense of that particular effort. $\endgroup$
    – MarcoB
    Commented May 25, 2015 at 18:02
  • $\begingroup$ @episanty I added an answer to explain what I believe is going on. $\endgroup$
    – Jens
    Commented May 25, 2015 at 23:29

Your Answer

By clicking “Post Your Answer”, you agree to our terms of service and acknowledge you have read our privacy policy.

Not the answer you're looking for? Browse other questions tagged or ask your own question.