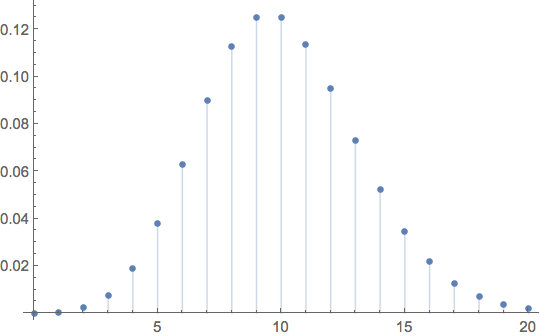
Tooltip works fine in ListPlot:
ListPlot[Table[Tooltip[PDF[PoissonDistribution[10], x]], {x, 0, 20}]]
in which the decimal value of the distribution at a point is revealed when a cursor is placed over that data point.
How does one get the same functionality using DiscretePlot? For instance,
DiscretePlot[Tooltip[PDF[PoissonDistribution[10], x]], {x, 0, 20}]
reveals "PDF[PoissonDistribution[10], x]" (rather than the desired numerical value) when a cursor is placed over a data point.
I've tried a number of obvious alternatives, such as Tooltip with two arguments and Evaluate or N (numerical value) applied to the PDF. None work.

