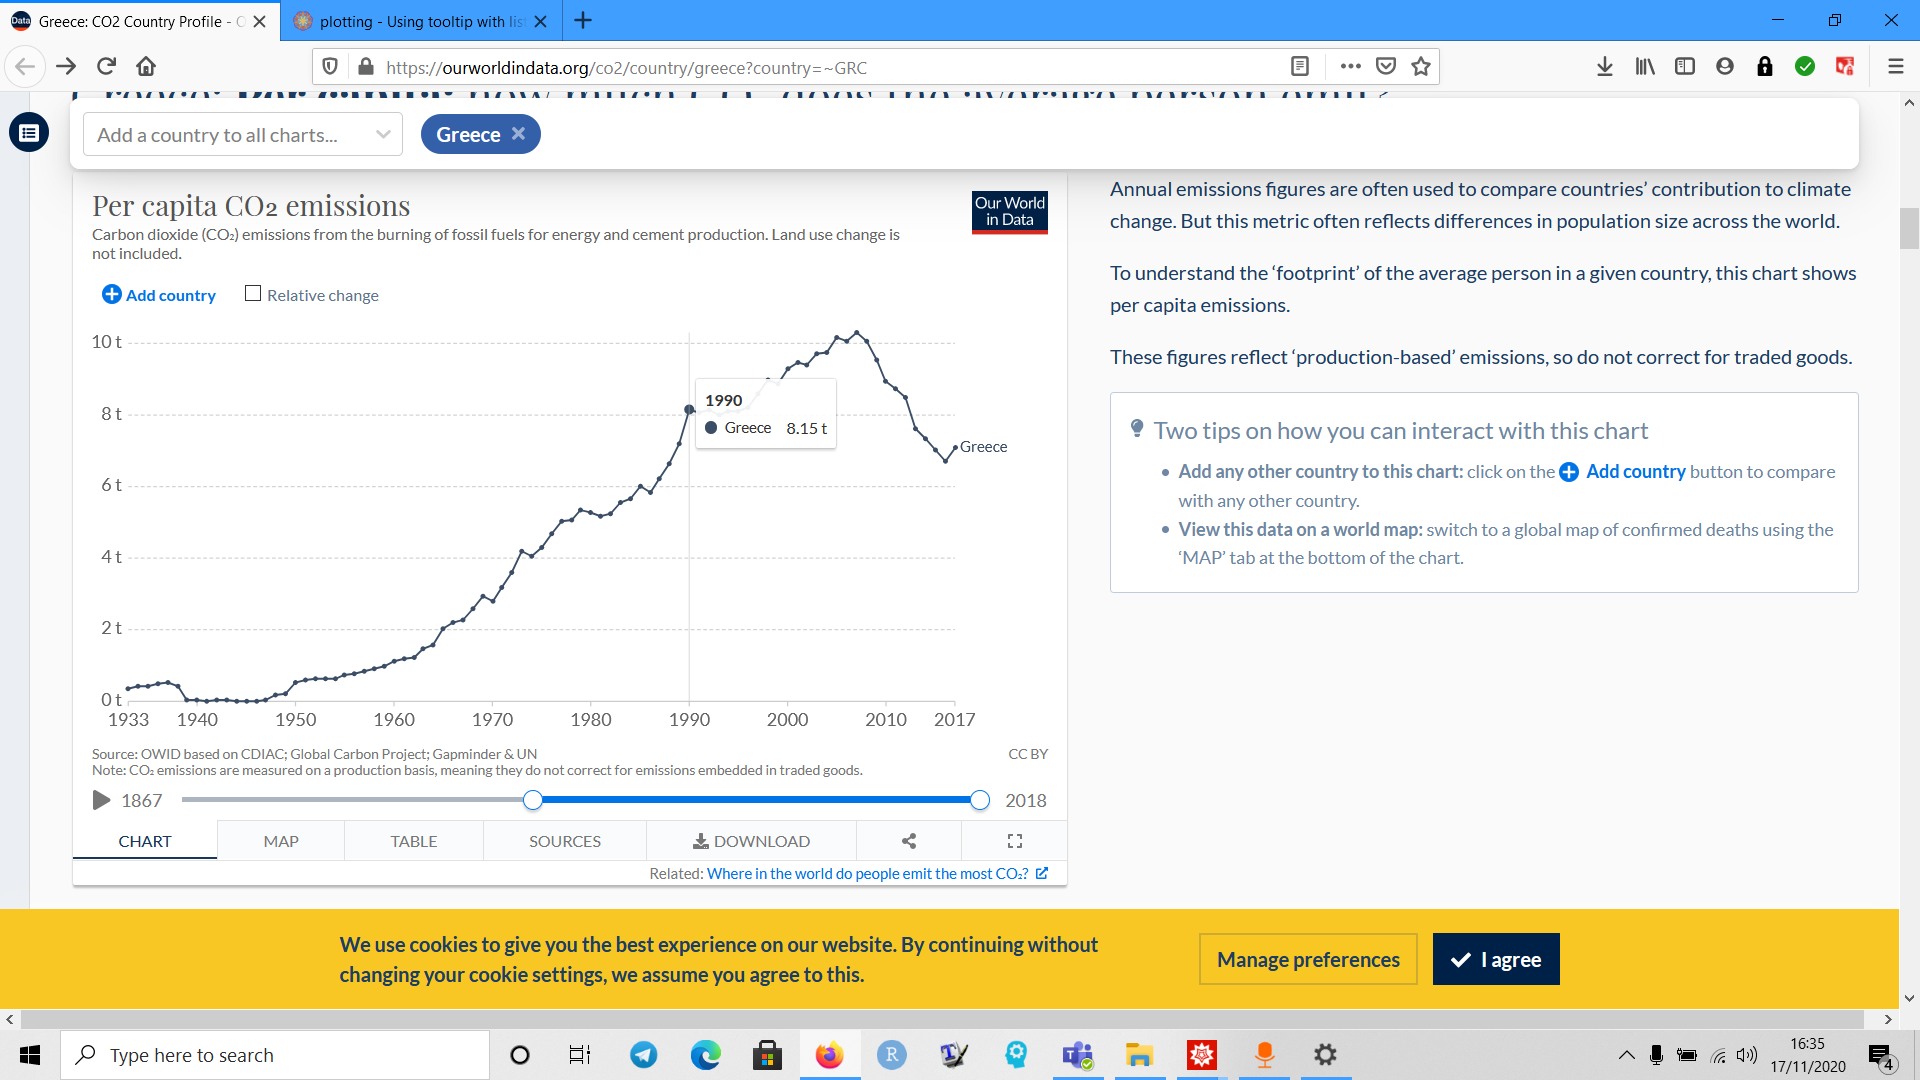
I'm trying generate a simlilar graph to the one shown at https://ourworldindata.org/co2/country/greece?country=~GRC
On this graph, when you hover over a data point, the information is displayed and a vertical line is generated.
Here is some data.
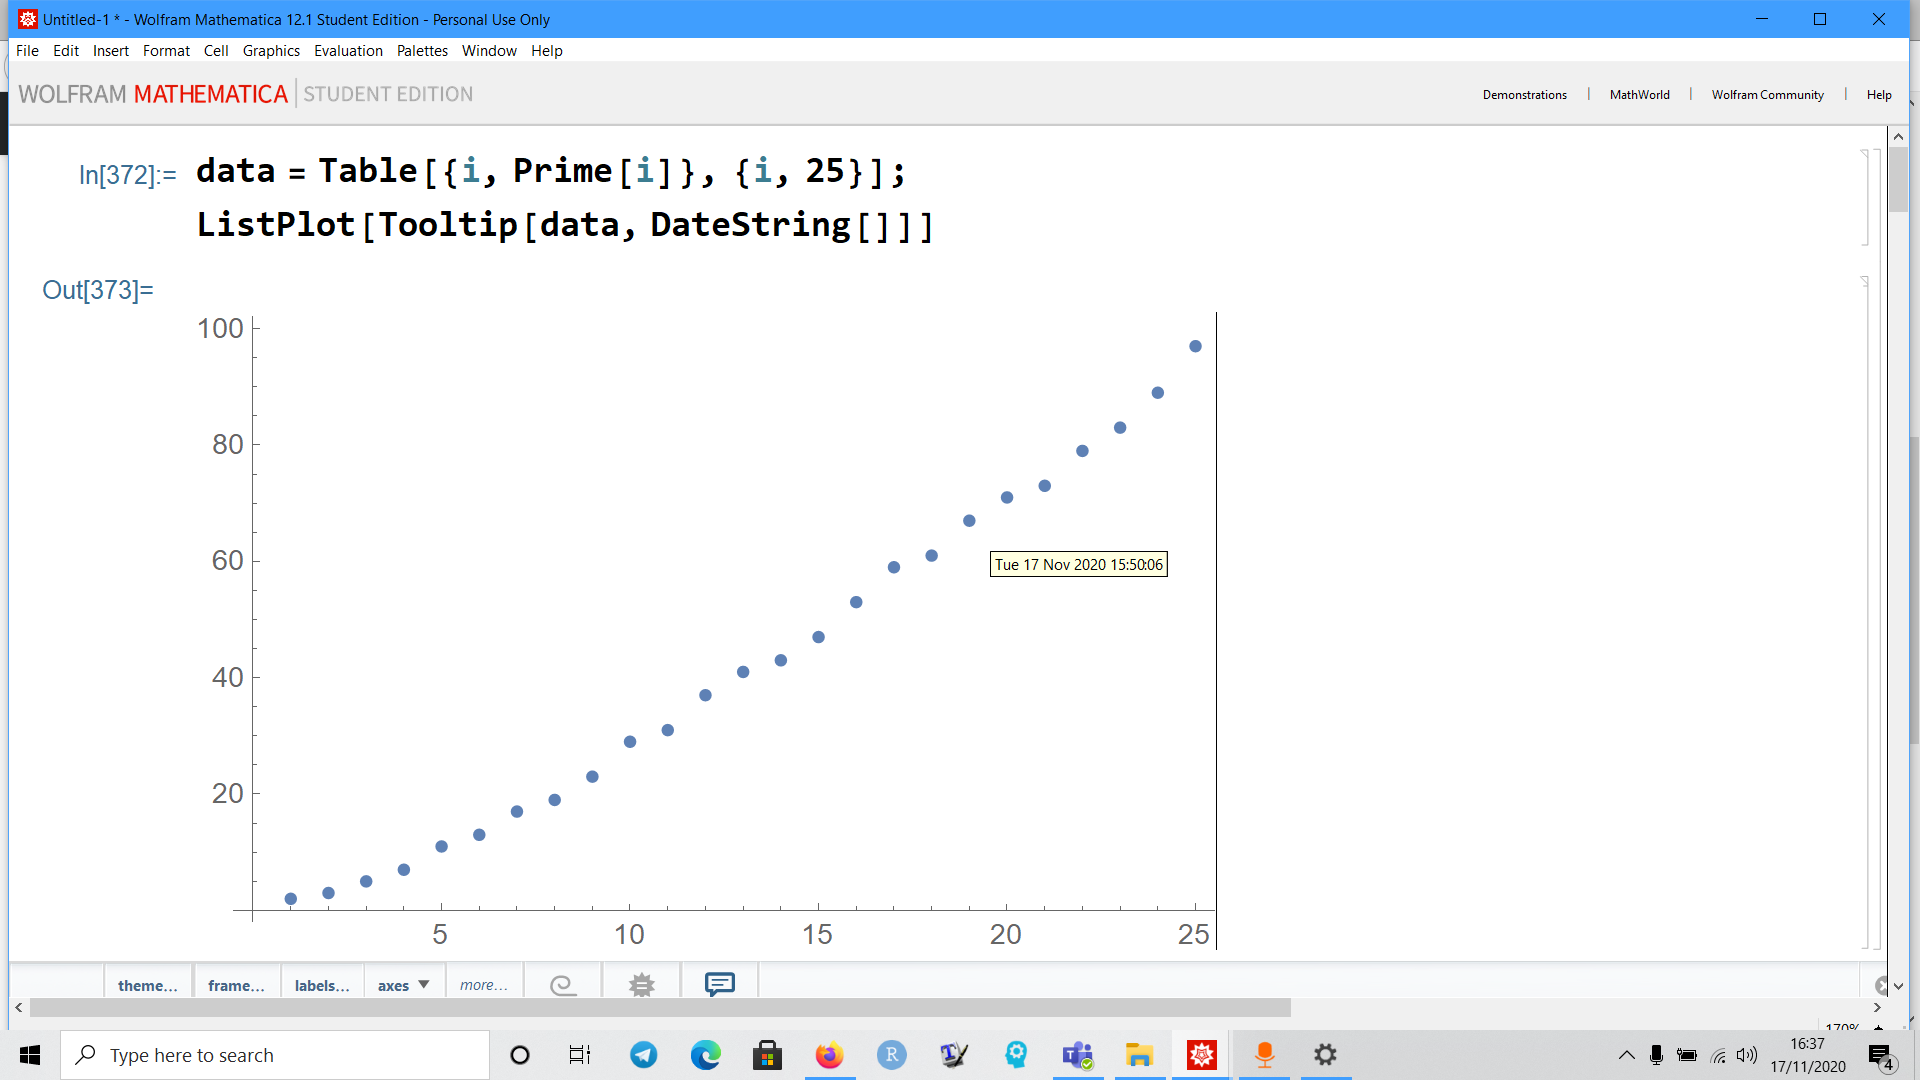
data = Table[{i, Prime[i]}, {i, 25}];
ListPlot[Tooltip[data, DateString[]]]
This generates a graph that when you hover over a data point, the date is displayed.
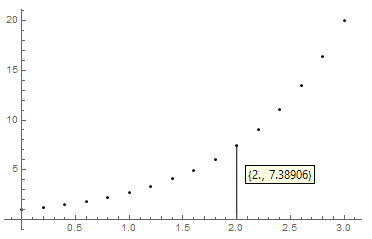
How can I generate a plot, that when i hover over the point, a vertical line is generated like in the example?


