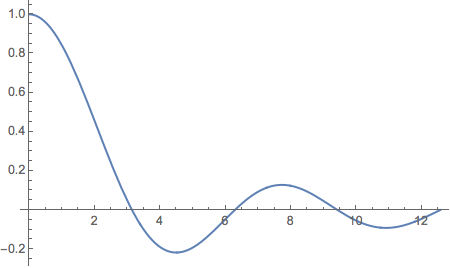
I'm currently working on a demonstration and attempting to utilize the Interpretation command based on the example provided in the "Generalized Input" tutorial here.
Regarding the particular example of plotting a function over a specified interval:
Interpretation[
    {f = Sin[x], min = 0, max = 2 Pi},
    Panel[
        Grid[
            {{Style["Plot", Bold], SpanFromLeft},
             {"Function:", InputField[Dynamic[f]]},
             {"Min:", InputField[Dynamic[min]]},
             {"Max:", InputField[Dynamic[max]]}}
             ]
     ],
    Plot[f, {x, min, max}]
 ]
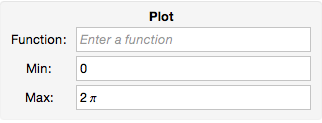
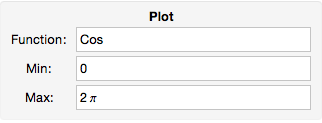
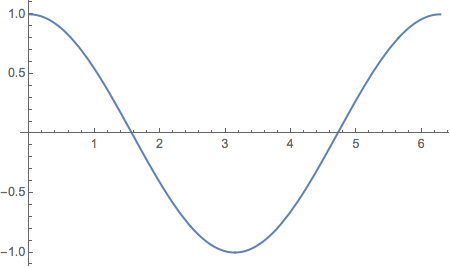
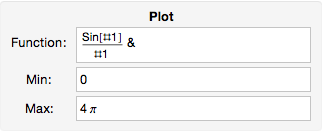
Evaluating this cell sets the sine function as the default plot, but I would like to have the reader put their own in. I've tried setting f=Invisible[1] with the hopes of having anything entered multiplied by an unseen 1, but entering anything becomes invisible. I've also tried using Spacer[1] which works as far as what I want to have, but evaluating the cell generates a template with awkward placement of the "Function:" label. This is fixed once a function is entered.
Is there a way I can make the input boxes blank from the start? Or at least a prettier use of Spacer?
Edit: Another problem with using Spacer here is that plugging in negative numbers for the plot range make it say things like -4+, which prevents an actual plot from being made.
Edit: After some sifting through the documentation, I came across a similar example:
Panel[
    DynamicModule[
        {f = Sin[x]},
        Column[{InputField[Dynamic[f]], Dynamic[Plot[f, {x, -5, 5}]]}]
        ]
]
Would it be any easier to adapt the blank-input idea to this code?

