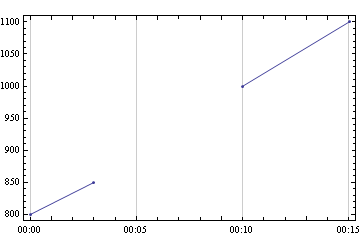
I have approximately 250,000 rows of data that looks like:
2015-02-28 00:00:00, 252.29
2015-02-28 00:05:00, 252.62
2015-02-28 00:10:00, 252.33
2015-02-28 00:15:00, missing
2015-02-28 00:20:00, 252.99
...
That means that in the first column I have the date along with specific time. In the second column I have the price. Moreover, some values are missing (instead of price, there is, e.g., "infinity").
I want to plot this dataset (on x-axis: date, on y-axis: price) and if the data points are missing to discontinue the plot and continue in the place where price is not missing. There may be 1,000 of subsequent observations that have no price and that is the reason why I want to explicitly show on the graph that there is a gap.
I tried something like this:
data = Import["data.csv", "CSV"]

dateplot[data_, label_] :=
  DateListPlot[data,
    Frame -> True,
    Joined -> True,
    PlotRange -> All,
    PlotStyle -> Blue,
    ImageSize -> 800,
    AspectRatio -> 0.4,
    FrameLabel -> {"", "", Style[label, 14]}]

price = Table[Total[data[[i]]], {i, 1, Length[data]}];

dateplot[price, ""]
but it did not work properly. I would appreciate any suggestion. I am really desperate.


priceto see what you were actually plotting? That is almost always a good idea, Try something likeprice // Short$\endgroup$