5
$\begingroup$

I have a set of data organized as a list where each list entry represents a day of the week. The data starts on a Sunday. It represents about 5 months of data. Each element of the list is {date,value} where date is a full calendar date. Thus, the data looks like {{date,value},{date,value},...}.

I have been successful with the DateListPlot function but I want the labeling of the X-Axis to show groups of 7 data points labeled as "Week 1", "Week 2", and so forth. I would like a single tic-mark between the weekly groups of 7.

I am very new to Mathematica graphics functions and I must admit that finding out and learning how to do this from the documentation is not easy.

$\endgroup$
1
  • $\begingroup$ to let you know, having made a 2nd Update with improvements and tidy up. Likely, speed is not an issue for a 5 months data set. However it may be interesting to know that using DayRange is about 100 times faster than using Select or Pick in combination with DateRange . Enjoy "playing" with Mathematica, as you mention in your profile.... $\endgroup$
    – penguin77
    Commented Apr 14, 2015 at 22:53

2 Answers 2

8
$\begingroup$
wd = WeatherData["SanDiego", "Temperature", {"Jan. 1, 2014", "Aug. 1, 2014", "Day"}];

(*   for version 10+ evaluate:  wd = wd // Normal // QuantityMagnitude;   *)

sundays = Pick[wd[[All, 1]], DayName /@ wd[[All, 1]], Sunday];
wednesdays = Pick[wd[[All, 1]], DayName /@ wd[[All, 1]], Wednesday];

Ticks at Wednesday noon:

ticks = MapIndexed[{AbsoluteTime[#] + 60 60 12, 
     Rotate["Week " <> ToString[First@#2], Pi/2]} &, wednesdays];

DateListPlot[wd, BaseStyle -> Thick, AspectRatio -> 1/4,
 FrameTicks -> {ticks, Automatic, None, None}, 
 GridLines -> {sundays, None}, ImageSize -> 900, Joined -> True]

enter image description here

Update:

You can also use DayMatchQ instead of DayName[#]==...:

Pick[wd[[All, 1]], DayMatchQ[#, Wednesday] & /@ wd[[All, 1]]] == wednesdays
(* True *)

Use different colors for different weeks:

wd = WeatherData["Kirkland", "Temperature", {"Jan. 1, 2014", "Aug. 1, 2014", "Day"}];
wd2 = wd /. {x_, y_} /; DayMatchQ[x, Sunday] :> Sequence[{x, y}, {x, y}];
wd2b = Split[wd2, ! (DayMatchQ[#[[1]], Sunday] && DayMatchQ[#2[[1]], Sunday]) &];
DateListPlot[wd2b, BaseStyle -> Thick, AspectRatio -> 1/4, 
 FrameTicks -> {ticks, Automatic, None, None}, GridLines -> {sundays, None},
 ImageSize -> 900, Joined -> True, Filling -> Bottom]

enter image description here

Update 2: If there are gaps in the data so that some Sundays and/or Wednesdays are skipped as in the example provided by @penguin77 in the comments, then you can use

dr = DateRange[wd[[1, 1]], wd[[-1, 1]]];
wednesdays = Pick[dr, DayMatchQ[#, Wednesday] & /@ dr];
sundays = Pick[dr, DayMatchQ[#, Sunday] & /@ dr];

Stealing and modifying @penguin77's great find we get a much cleaner way to get the dates we need for ticks and grid lines:

{wednesdays, sundays} = DayRange[## & @@ wd[[{1, -1}, 1]], #]&/@ {Wednesday, Sunday}

Splitting the data into separate weeks would be more involved in this case.

$\endgroup$
10
  • $\begingroup$ Are you using 10.1? In 10.0.2 this throws errors. wd[[All, 1]] is not valid. $\endgroup$
    – Mr.Wizard
    Commented Apr 12, 2015 at 21:07
  • $\begingroup$ @MrWizard, i am using version 9.0.1.0 (windows 8 64bit). $\endgroup$
    – kglr
    Commented Apr 12, 2015 at 21:08
  • $\begingroup$ It looks like we have an incompatible change. Do you have time to Chat? $\endgroup$
    – Mr.Wizard
    Commented Apr 12, 2015 at 21:10
  • $\begingroup$ @kguler when trying wd = WeatherData["WMO89009", "Temperature", {"Jun. 1, 2014", "Dec. 1, 2014", "Day"}]; proposed solution seems not to work (see missing grid line between week 6 and 7 and gap in week 8). It looks like that ticks and GridLines are dependent on data being systematically available for Sundays and Wednesday. Or am I missing something ? $\endgroup$
    – penguin77
    Commented Apr 14, 2015 at 13:27
  • $\begingroup$ @penguin77, you are right; I assumed there are no gaps in the data. If there are gaps ticks and gridlines can be off, so can the splitting into weeks. A more robust way would be to use DateRange of the data to identify Wednesday and Sunday dates:, e.g., wednesdays = Pick[DateRange[wd[[1, 1]], wd[[-1, 1]]], DayName /@ DateRange[wd[[1, 1]], wd[[-1, 1]]], Wednesday]; sundays = Pick[DateRange[wd[[1, 1]], wd[[-1, 1]]], DayName /@ DateRange[wd[[1, 1]], wd[[-1, 1]]], Sunday]; $\endgroup$
    – kglr
    Commented Apr 14, 2015 at 13:51
4
$\begingroup$

Creating a data set dset with date values for the period of 5 months starting on a Sunday associated with random integers ( DayName @ {2015, 04, 12} (* Sunday*)).

dset = DateRange[{2015, 04, 12}, 
     DatePlus[{2015, 04, 12}, {5, "Month"}], 
     Quantity[1, "Days"]] // {#, RandomInteger[100, Length @  #]} &  //
    Transpose ;

To create tick marks, FoldList gets all Wednesdays (Sunday + 4) from the dset by using DatePlus which is then associated with tick labels in the postfix expressions.

ticks = FoldList[DatePlus[#, {1, "Week"}] &, DatePlus[dset[[1, 1]], {4, "Day"}], 
 dset[[All, 1]]] // {#, 
  Rotate["Week " <> ToString @#, \[Pi]/2] & /@ 
   Range @ Length@# } &   // Transpose;

The grid corresponds to the starting of a week. E.g. Week 1 starts on the first Sunday. Therefore the value associated with Sunday lays on the first line and 6 points lay in between.

grid = FoldList[DatePlus[#, {1, "Week"}] &, dset[[1, 1]], 
  dset[[All, 1]]];

And here the plot

DateListPlot[dset, Ticks -> {ticks, Automatic}, 
 AxesOrigin -> {DatePlus[dset[[1, 1]], {-1, "Week"}], 0}, 
 GridLines -> {grid, None}, Axes -> True, ImageSize -> 800, 
 Frame -> False]
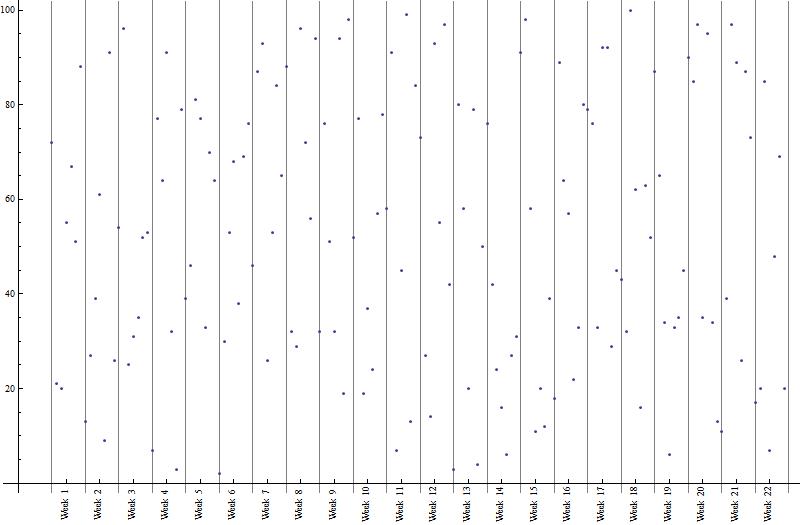
enter image description here

Update 1

To demonstrate that above solution works as well if there are gaps of data points, because the ticks and grid lines do not depend on availability of data points.

Here a data set from Amundsen-Scott 90°00’S with temperature measurements in irregular intervals.

dset = WeatherData["WMO89009", 
   "Temperature", {"Jun. 1, 2014", "Dec. 1, 2014", "Day"}];

Here a more robust way to generate ticks and grid lines, in order NOT to be dependent on first date value being a Sunday. Derived from idea presented by @kguler

ticks = Select[DateRange[dset[[1, 1]], dset[[-1, 1]]] , 
    DayMatchQ[#, Wednesday] &] // {#, 
     Rotate["Week " <> ToString@#, \[Pi]/2] & /@ Range@Length@#} & // 
  Transpose;

grid = Select[DateRange[dset[[1, 1]], dset[[-1, 1]]] , 
      DayMatchQ[#, Sunday] &];

And here the plot again

DateListPlot[dset, Ticks -> {ticks, Automatic}, 
 AxesOrigin -> {DatePlus[dset[[1, 1]], {-1, "Week"}], 0}, 
 GridLines -> {grid, None}, Axes -> True, ImageSize -> 800, 
 Frame -> False]

Points have intentionally not be joined in order to see the irregularity of measurements being taken. (I know, the question assumes 7 data points within 7 days, by the way not stating one on each day. Whereas the data points from Amundsen-Scott have an irregular number of measurements within 7 days and is only meant for demonstrating how to handle this special case.
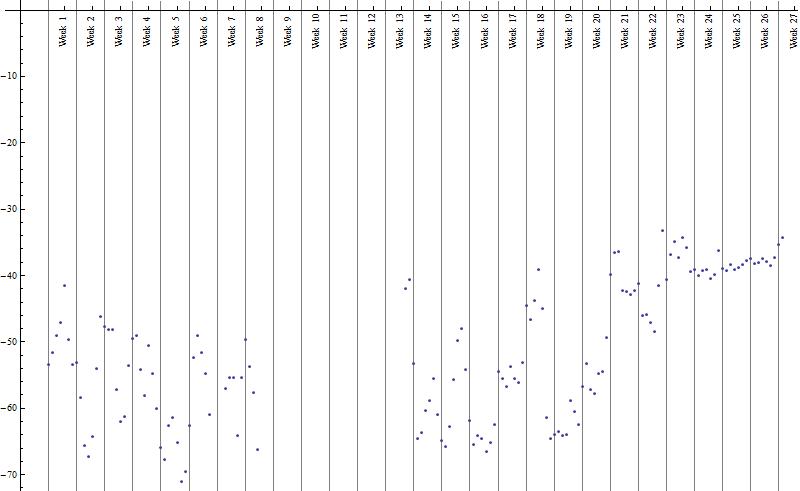
enter image description here

Update 2

Weather data from the South Pole:

dset = WeatherData["WMO89009", 
   "Temperature", {"Jun. 1, 2014", "Dec. 1, 2014", "Day"}];

Using DayRange is about 100 times faster to create ticks and grid than using Pick or Select in combination with DateRange.

fnDayDates[d_, dset_] := DayRange[First@First@#, First@Last@#, d]&[dset]

ticks = fnDayDates[Wednesday,dset] // 
        {#,Rotate["Week " <> ToString@#, \[Pi]/2] & /@ Range@Length@#}& //
        Transpose;

Here we go:

colorAntarctic[ z_ ] := Lighter @ RGBColor[z/2, 1 - z, 1];

DateListPlot[dset, Ticks -> {ticks, Automatic}, 
 TicksStyle -> Directive[ Bold, 12], 
 AxesOrigin -> {DatePlus[dset[[1, 1]], {-1, "Week"}], 0}, 
 GridLines -> {fnDayDates[Sunday, dset], None}, 
 ColorFunction -> colorAntarctic, Axes -> True, Filling -> Axis, 
 PlotMarkers -> Automatic,  Joined -> True, AspectRatio -> 1/3, 
 ImageSize -> 800, Frame -> False, 
 PlotLabel -> 
  Style["South Pole 90\[Degree]00\[CloseCurlyQuote]S - Jun. 1, \
2014-Dec. 1, 2014", Bold, 14]]
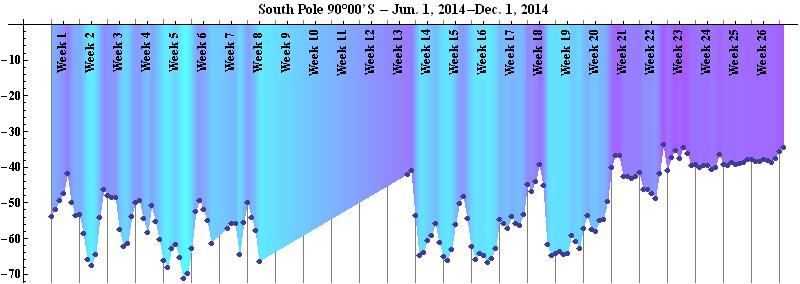
enter image description here

PS: by the way, penguins don't care, hi,hi,hi

$\endgroup$
1
  • $\begingroup$ Thanks for your answers. I need to study these and see how I will fit into the way that I am handling the data and see what works (or variations) of what works best. At least now I get the idea of what both of these examples are doing. $\endgroup$
    – K7PEH
    Commented Apr 12, 2015 at 22:33

Your Answer

By clicking “Post Your Answer”, you agree to our terms of service and acknowledge you have read our privacy policy.

Not the answer you're looking for? Browse other questions tagged or ask your own question.