0
$\begingroup$

I have approximately 250,000 rows of data that looks like:

2015-02-28 00:00:00, 252.29 
2015-02-28 00:05:00, 252.62 
2015-02-28 00:10:00, 252.33
2015-02-28 00:15:00, missing    
2015-02-28 00:20:00, 252.99
...

That means that in the first column I have the date along with specific time. In the second column I have the price. Moreover, some values are missing (instead of price, there is, e.g., "infinity").

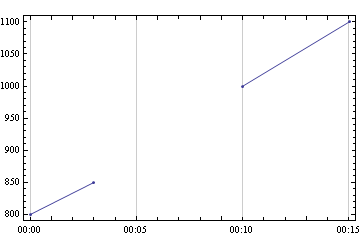
I want to plot this dataset (on x-axis: date, on y-axis: price) and if the data points are missing to discontinue the plot and continue in the place where price is not missing. There may be 1,000 of subsequent observations that have no price and that is the reason why I want to explicitly show on the graph that there is a gap.

I tried something like this:

data = Import["data.csv", "CSV"]

dateplot[data_, label_] := 
  DateListPlot[data, 
    Frame -> True, 
    Joined -> True, 
    PlotRange -> All, 
    PlotStyle -> Blue, 
    ImageSize -> 800, 
    AspectRatio -> 0.4, 
    FrameLabel -> {"", "", Style[label, 14]}]

price = Table[Total[data[[i]]], {i, 1, Length[data]}];

dateplot[price, ""]

but it did not work properly. I would appreciate any suggestion. I am really desperate.

$\endgroup$
4
  • $\begingroup$ Did you look at least some of the values in price to see what you were actually plotting? That is almost always a good idea, Try something like price // Short $\endgroup$
    – m_goldberg
    Commented Mar 15, 2015 at 0:29
  • $\begingroup$ Forget the Import for now, try it with a List containing a few values and come back with the results $\endgroup$ Commented Mar 15, 2015 at 0:33
  • 1
    $\begingroup$ Welcome to Mathematica.SE! I suggest the following: 0) Browse the common pitfalls question 1) As you receive help, try to give it too, by answering questions in your area of expertise. 2) Read the faq! 3) When you see good questions and answers, vote them up by clicking the gray triangles, because the credibility of the system is based on the reputation gained by users sharing their knowledge. Also, please remember to accept the answer, if any, that solves your problem, by clicking the checkmark sign! $\endgroup$ Commented Mar 15, 2015 at 0:34
  • $\begingroup$ "did not work properly." doesn't explain your difficulties very well, does it? $\endgroup$ Commented Mar 15, 2015 at 13:46

1 Answer 1

0
$\begingroup$
dateplot[data_] := DateListPlot[data, Joined -> True, PlotRange -> All, Mesh -> All]

 bbb = {{{2012, 1, 1, 0, 0}, 800}, {{2012, 1, 1, 0, 3}, 850},
        {{2012, 1, 1, 0, 5}, infinity}, {{2012, 1, 1, 0, 7}, whatever},
        {{2012, 1, 1, 0, 10}, 1000}, {{2012, 1, 1, 0, 15}, 1100}}

dateplot[bbb]

Mathematica graphics

$\endgroup$
0

Your Answer

By clicking “Post Your Answer”, you agree to our terms of service and acknowledge you have read our privacy policy.

Not the answer you're looking for? Browse other questions tagged or ask your own question.