2
$\begingroup$

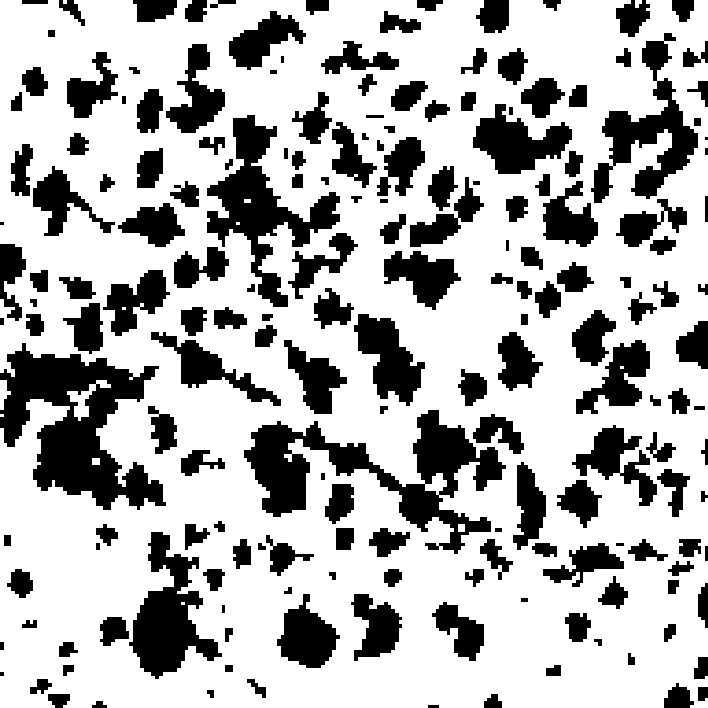
I am new to Mathematica, and I have read this post to understand how to perform Fourier transform on an image. My mission is to extract information on the typical distance between the black patches in the image I have attached here. The code that I attach here gives me the Fourier transform, but I don't know how to take out from the Fourier transform the values of the wavenumbers.

I have used this piece of code

img = Import["example.jpg"];
Image[img, ImageSize -> 300]

data = ImageData[img];(*get data*)
{nRow, nCol, nChannel} = Dimensions[data];
d = data[[All, All, 2]];
d = d*(-1)^Table[i + j, {i, nRow}, {j, nCol}];
fw = Fourier[d, FourierParameters -> {1, 1}];

(*adjust for better viewing as needed*)
fudgeFactor = 100;
abs = fudgeFactor*Log[1 + Abs@fw];
Labeled[Image[abs/Max[abs], ImageSize -> 300],Style["Magnitude spectrum", 18]]

I have the following image on which I would like to perform this analysis - enter image description here
$\endgroup$
3
  • $\begingroup$ fw contains the values. I.e. fw[[1,1]] is the value for frequency 0/0, fw[[1,2]] is the value for frequency 0/1... $\endgroup$ Commented Feb 11, 2015 at 14:05
  • 1
    $\begingroup$ What nikie says. You'd probably want to leave out the line d = d*(-1)^Table[i + j, {i, nRow}, {j, nCol}]; which seems to apply some checkerboard pattern to the white background pixels. $\endgroup$ Commented Feb 11, 2015 at 14:58
  • 1
    $\begingroup$ @SjoerdC.deVries is right, I didn't notice that. IIRC, this is done to "rotate" the 0 frequencies to the center of the FFT output. If you want to interpret the values numerically (instead of displaying the FT as a picture), you'd want to remove that line. $\endgroup$ Commented Feb 11, 2015 at 15:05

3 Answers 3

3
$\begingroup$

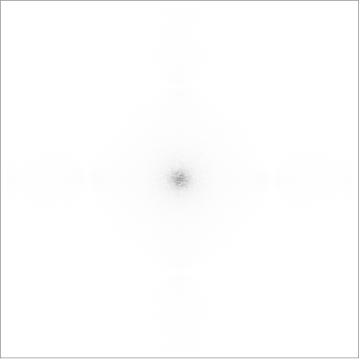
It looks like random blobs, and that's what the FFT suggests...

img = Import["https://i.sstatic.net/hALsH.jpg"];
imgBW = ImageData@ColorConvert[img, "Grayscale"];
imgZ = imgBW - Mean@Mean[imgBW]; 
xf = Abs[Fourier[imgZ, FourierParameters -> {1, -1}]];
{d1, d2} = Ceiling[Dimensions[xf]/2];
xCentered = RotateLeft[xf, {d1, d2}];
ArrayPlot[xCentered]

enter image description here

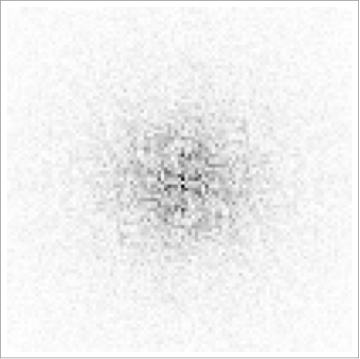
Here we zoom into the center where we can see it looks a lot like a randomized Gaussian blob:

zoom = 50; 
ArrayPlot[xCentered, PlotRange -> {{d1 - zoom, d1 + zoom}, {d2 - zoom, d2 + zoom}}]

enter image description here

I think this means you are going to have to approach this a different way.

$\endgroup$
1
  • 1
    $\begingroup$ If I squint I see the letter S in the zoomed center $\endgroup$
    – shrx
    Commented May 14, 2016 at 18:28
3
$\begingroup$

This is not an answer more of an extended comment...

My mission is to extract information on the typical distance between the black patches in the image I have attached here.

Do we have to use Fourier transform for this?

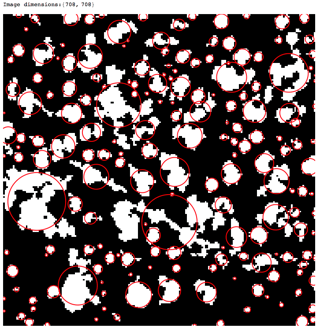
For example we can get the required estimate with these commands:

img = Import["https://i.sstatic.net/hALsH.jpg"];
Row[{"Image dimensions:", ImageDimensions[img]}]
imgB = ColorNegate@Binarize[img, 0.4];
Block[{img = imgB}, 
 Show[img, 
  Graphics[{Red, Thick, 
    Circle[#[[1]], #[[2]]] & /@ 
     ComponentMeasurements[
       img, {"Centroid", "EquivalentDiskRadius"}][[All, 2]]}]]
 ]

comps = ComponentMeasurements[
    imgB, {"Centroid", "EquivalentDiskRadius"}][[All, 2]];

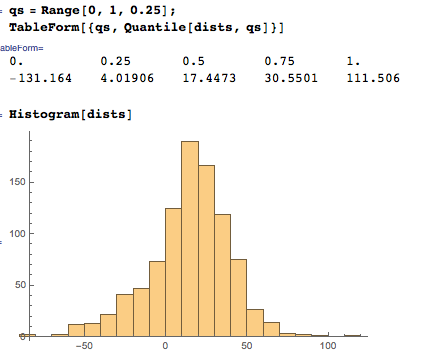
dists = Flatten@
   Map[Take[Sort[#], UpTo[5]] &, 
    Outer[EuclideanDistance[#1[[1]], #2[[1]]] - (#1[[2]] + #2[[2]]) &,
      comps, comps, 1]];

qs = Range[0, 1, 0.25];
TableForm[{qs, Quantile[dists, qs]}]

Histogram[dists]

$\endgroup$
2
$\begingroup$

One approach is to locate the black components and then measure some properties of them. Here we locate them using MorphologicalComponents, find the centroids using ComponentMeasurements and then calculate the distance between the centroids using Nearest.

img = Import["https://i.sstatic.net/hALsH.jpg"];
imgBW = Binarize@ColorConvert[img, "Grayscale"];
comp = MorphologicalComponents[ColorNegate[Dilation[imgBW, 5]]] // Colorize
cent = ComponentMeasurements[comp, "Centroid"]; 
allNears = Nearest[cent[[All, 2]], #, 2] & /@ cent[[All, 2]];
Total[Norm[allNears[[#, 1]] - allNears[[#, 2]]] & /@ 
      Range[Length[allNears]]]/Length[allNears]

As you can see, the average distance form the center of each blob to the nearest adjacent blob is about 33 pixels.

enter image description here

$\endgroup$
3
  • $\begingroup$ Basically very similar to my answer (+1, btw). I do like the application of Nearest and Dilation. (A minor point, I think using Mean/Median might be better than using Total[_]/Length[_]. $\endgroup$ Commented May 14, 2016 at 15:28
  • $\begingroup$ @Anton -- after I finished the Fourier answer, I worked out the morphological approach - by the time I finished, you had already posted... so +1 to you for beating me! $\endgroup$
    – bill s
    Commented May 14, 2016 at 15:54
  • $\begingroup$ I think you should combine your FFT answer with this one. From my perspective, after applying FFT and concluding non-regularity the next natural thing to do is to apply the morphological components approach. $\endgroup$ Commented May 14, 2016 at 15:59

Your Answer

By clicking “Post Your Answer”, you agree to our terms of service and acknowledge you have read our privacy policy.

Not the answer you're looking for? Browse other questions tagged or ask your own question.