I am new to Mathematica, and using version 8.0.
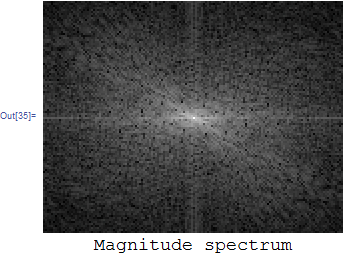
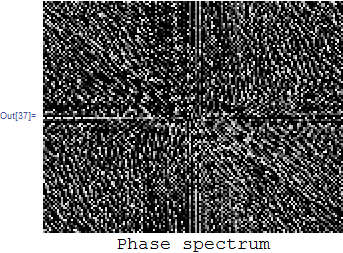
I would like to calculate the 2D Fourier Transform of an Image with Mathematica and plot the magnitude and phase spectrum, as well as reconstruct the image with the inverse transform.
I am new to Mathematica, and using version 8.0.
I would like to calculate the 2D Fourier Transform of an Image with Mathematica and plot the magnitude and phase spectrum, as well as reconstruct the image with the inverse transform.
img = Import["ExampleData/lena.tif"];
Image[img, ImageSize -> 300]

data = ImageData[img];(*get data*)
{nRow, nCol, nChannel} = Dimensions[data];
d = data[[All, All, 2]];
d = d*(-1)^Table[i + j, {i, nRow}, {j, nCol}];
fw = Fourier[d, FourierParameters -> {1, 1}];

(*adjust for better viewing as needed*)
fudgeFactor = 100;
abs = fudgeFactor*Log[1 + Abs@fw];
Labeled[Image[abs/Max[abs], ImageSize -> 300],Style["Magnitude spectrum", 18]]

arg = Arg@fw;
Labeled[Image[arg/Max[arg], ImageSize -> 300],Style["Phase spectrum", 18]]

ps. I do think Ms. Lena looks prettier in the spatial domain than in the frequency domain.
Taking the Fourier transform is easy and fun!
Let's strip away some of the complexities. First, remove the color from the image, since this just complicates things (you can always take the transform of each color channel separately).
img = ColorConvert[Import["ExampleData/lena.tif"], "Grayscale"];
Here are the magnitude and phase of the Fourier transform:
(abs = Abs[Fourier[ImageData[img]]]) // Image
(arg = Arg[Fourier[ImageData[img]]]) // Image
To invert these, use:
Chop[InverseFourier[(abs E^(I arg))]] // Image
which is the same as we started with. The Chop is needed because spurious (almost zero) complex numbers remain after the Inverse).
Notice how clear and concise this is... it's just taking Fourier of the image, taking the Abs and Arg to get the magnitude and phase images, and then reconstructing using InverseFourier on Abs*Exp[I Arg].
This is a bit simpler than usual. For one thing, the zero frequency is in the upper left hand corner (instead of the center, where one usually plots it). You can move this to the center using RotateLeft on the transformed image, or by multiplying in the spatial domain by +/-1^(i,j) as in Nasser's answer. Of course, then, to reconstruct, you have to rotate back. This also uses the default FourierParameters, which may or may not be exactly what you want.
Mathematica also has a builtin function called ImagePeriodogram that returns an Image representing the power spectrum of the image. This won't help with phase spectra or reconstructing images, however.