You can try this for yourself. Run the following code a couple of times:
Show[
 Plot[PDF[ExponentialDistribution[1/2], x], {x, 0, 10},
  Filling -> Bottom, PlotStyle -> Red],
 SmoothHistogram[RandomVariate[ExponentialDistribution[1/2], 500],
  Filling -> Bottom],
 PlotRangeClipping -> True, PlotRange -> {{0, 10}, Automatic}]
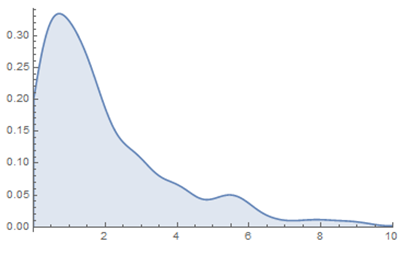
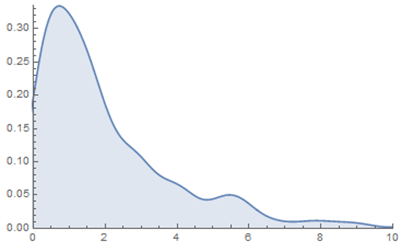
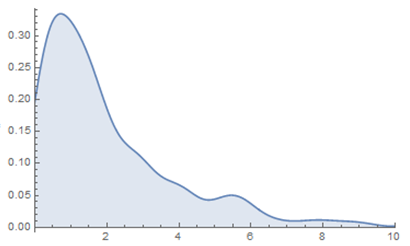
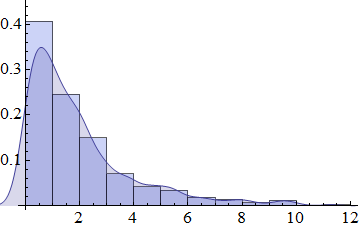
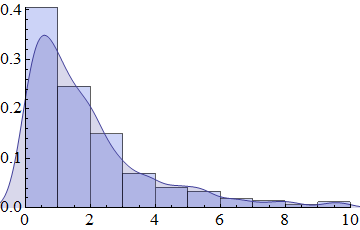
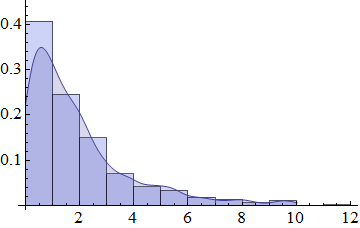
Eventually you'll find a misbehaved plot where the smooth histogram is completely out of the graphics bounds, even interfering with other cells of the notebook (you might have to execute the above code a couple of times to see this effect, due to the randomness of the data).
If I export the graphic to pdf, the same issue is visible in the pdf (when I export a grid of these plots, the smooth histograms from one row interfere with the row above).
For example:
 GraphicsGrid[Partition[Table[Show[
Plot[PDF[ExponentialDistribution[1/2], x], {x, 0, 10},
 Filling -> Bottom, PlotStyle -> Red],
SmoothHistogram[RandomVariate[ExponentialDistribution[1/2], 500],
 Filling -> Bottom],
PlotRangeClipping -> True, PlotRange -> {{0, 10}, Automatic}], {i,
 1, 25}], 5]]
which gives the following output:
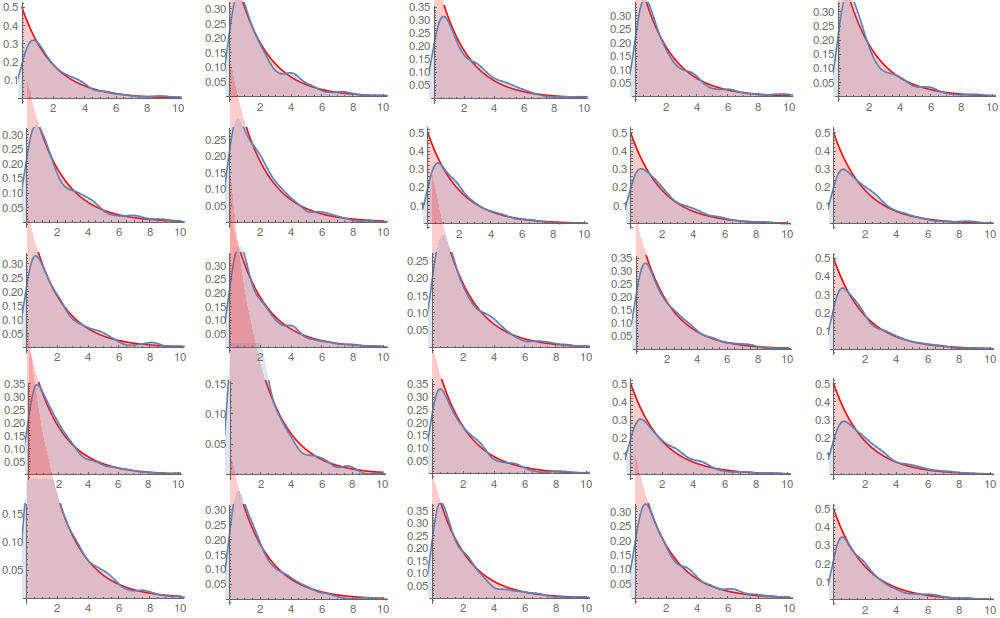
Why does this happen? Is this a bug? How can I fix it?

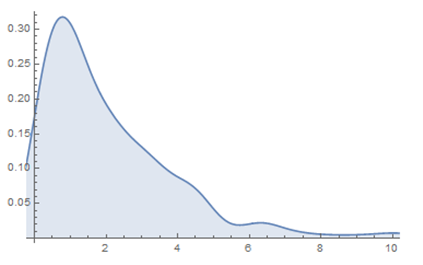
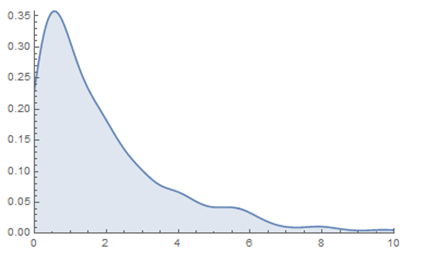
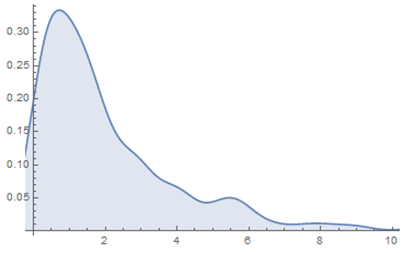
SmoothHistogramand also isn't caused by an incorrectPlotRangeClipping, but is the result of a wrongPlotRangePaddingadded byShow. $\endgroup$