An alternative is to use RegionFunction.
Just to revisit this question, I've found that Karsen 7.'s solution is not always working for me (at least on version 9). Suppose we want to show both a Histogram and a SmoothHistogram. So we try:
Show[Histogram[data, Automatic, "PDF"], SmoothHistogram[data, Filling -> Bottom]]
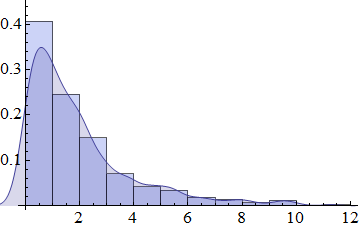
And we get the problem as expected.
Now we try the PlotRangePadding trick:
Show[Histogram[data, Automatic, "PDF"], SmoothHistogram[data, Filling -> Bottom],
 PlotRange -> {{0, 10}, Automatic}, PlotRangePadding -> 0]
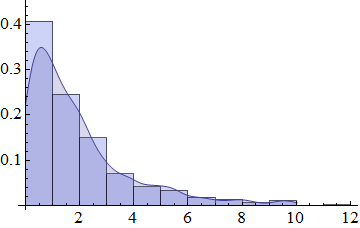
and it doesn't help:
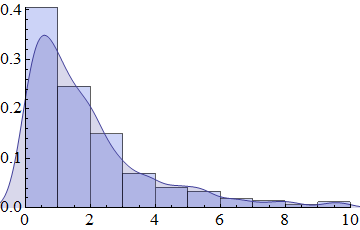
However, using a RegionFunction on the SmoothHistogram:
Show[Histogram[data, Automatic, "PDF"], SmoothHistogram[data, Filling -> Bottom,
  RegionFunction -> Function[{x, y}, 0 <= x <= 10]]10]]]


