8
$\begingroup$

You can try this for yourself. Run the following code a couple of times:

Show[
 Plot[PDF[ExponentialDistribution[1/2], x], {x, 0, 10}, 
  Filling -> Bottom, PlotStyle -> Red],
 SmoothHistogram[RandomVariate[ExponentialDistribution[1/2], 500], 
  Filling -> Bottom],
 PlotRangeClipping -> True, PlotRange -> {{0, 10}, Automatic}]

Eventually you'll find a misbehaved plot where the smooth histogram is completely out of the graphics bounds, even interfering with other cells of the notebook (you might have to execute the above code a couple of times to see this effect, due to the randomness of the data).

If I export the graphic to pdf, the same issue is visible in the pdf (when I export a grid of these plots, the smooth histograms from one row interfere with the row above).

For example:

 GraphicsGrid[Partition[Table[Show[
Plot[PDF[ExponentialDistribution[1/2], x], {x, 0, 10}, 
 Filling -> Bottom, PlotStyle -> Red],
SmoothHistogram[RandomVariate[ExponentialDistribution[1/2], 500], 
 Filling -> Bottom],
PlotRangeClipping -> True, PlotRange -> {{0, 10}, Automatic}], {i,
 1, 25}], 5]]

which gives the following output:
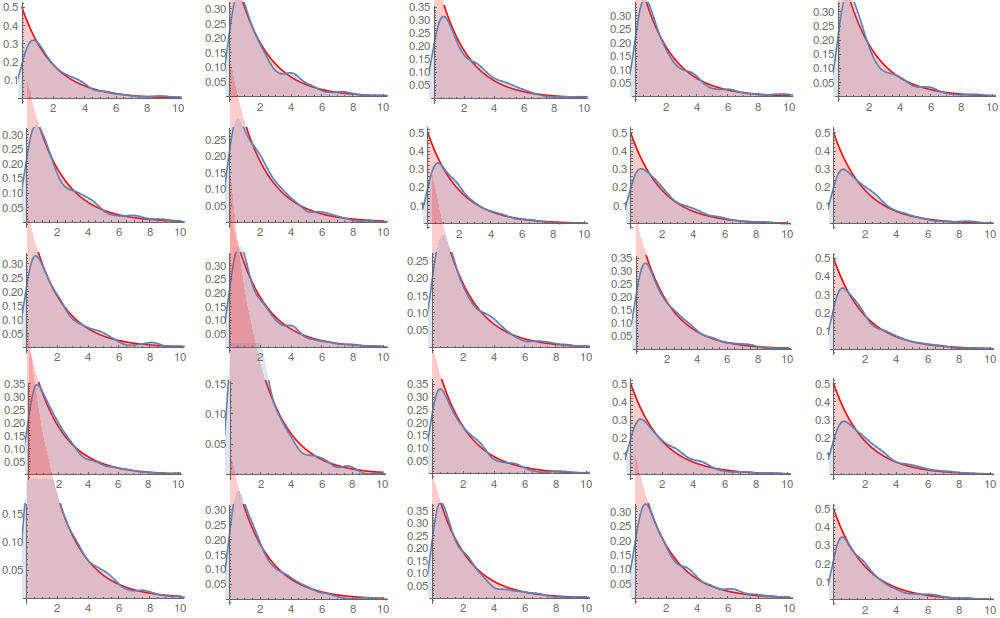
enter image description here

Why does this happen? Is this a bug? How can I fix it?

$\endgroup$
2
  • $\begingroup$ This issue is not limited to SmoothHistogram and also isn't caused by an incorrect PlotRangeClipping, but is the result of a wrong PlotRangePadding added by Show. $\endgroup$
    – Karsten7
    Commented Dec 23, 2014 at 0:09
  • $\begingroup$ It's version 10.4 and I'm still getting the same behavior. I filed a bug report. $\endgroup$
    – a06e
    Commented Mar 17, 2016 at 11:11

2 Answers 2

11
$\begingroup$

The quick workaround:

You have to add the option PlotRangePadding -> 0 (or its equivalent PlotRangePadding -> None) to Show.

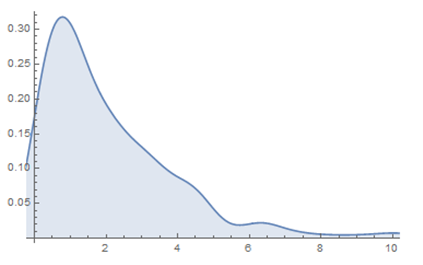
Show[SmoothHistogram[RandomVariate[ExponentialDistribution[1/2], 500], Filling -> Bottom], 
 PlotRangeClipping -> True, PlotRange -> {{0, 10}, Automatic}]

plot1

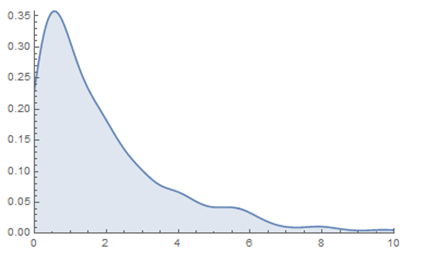
Show[SmoothHistogram[RandomVariate[ExponentialDistribution[1/2], 500], Filling -> Bottom], 
 PlotRangeClipping -> True, PlotRange -> {{0, 10}, Automatic}, PlotRangePadding -> 0]

plot2


The reason and its solution

The reason for this issue is a misbehavior of Show (or probably it's a bug), when it is used with a PlotRange option. This is independent of SmoothHistogram. It shows up, whenever the PlotRange specified in Show is smaller than the range in the original plot.

Simplifying the example:

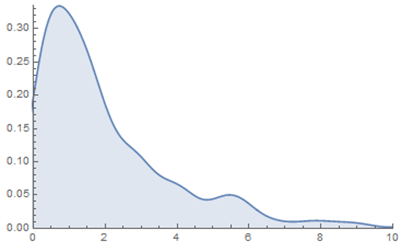
data = RandomVariate[ExponentialDistribution[1/2], 500];

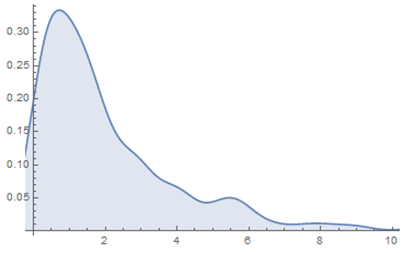
Show[SmoothHistogram[data, Filling -> Bottom], PlotRange -> {{0, 10}, Automatic}]

plot3

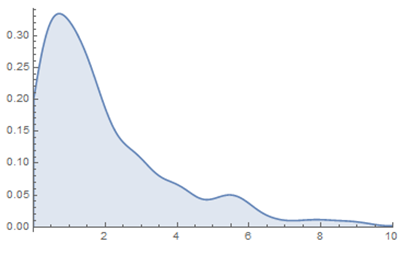
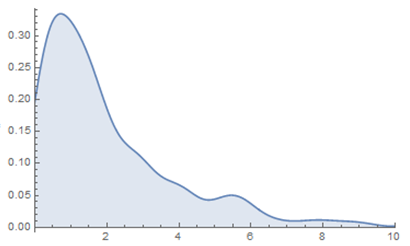
shows an incorrect PlotRange. One would expect the same output as from

SmoothHistogram[data, Filling -> Bottom, PlotRange -> {{0, 10}, Automatic}]

plot4

Using the "quick workaround"

Show[SmoothHistogram[data, Filling -> Bottom], PlotRange -> {{0, 10}, Automatic}, 
  PlotRangePadding -> 0]

plot5

one can still see a small overlap over the vertical axis.

Before we get to the final solution, let's check what the difference between using PlotRange within the original plot and within Show is.

AbsoluteOptions[
  SmoothHistogram[data, Filling -> Bottom, PlotRange -> {{0, 10}, Automatic}],  
  PlotRangePadding]
{PlotRangePadding -> {{0., 0.}, {Scaled[0.02], Scaled[0.02]}}}
AbsoluteOptions[
  Show[SmoothHistogram[data, Filling -> Bottom], PlotRange -> {{0, 10}, Automatic}], 
  PlotRangePadding]
{PlotRangePadding -> {{Scaled[0.02], Scaled[0.02]}, {Scaled[0.02], Scaled[0.02]}}}

Therefore one has to use the option PlotRangePadding -> {{0., 0.}, {Scaled[0.02], Scaled[0.02]}} in Show, in order to force Show to behave in the expected way when a PlotRange smaller than the range in the original plot is specified within Show.

Show[
  SmoothHistogram[data, Filling -> Bottom], 
  PlotRange -> {{0, 10}, Automatic}, 
  PlotRangePadding -> {{0., 0.}, {Scaled[0.02], Scaled[0.02]}}]

plot6

$\endgroup$
5
$\begingroup$

An alternative is to use RegionFunction.

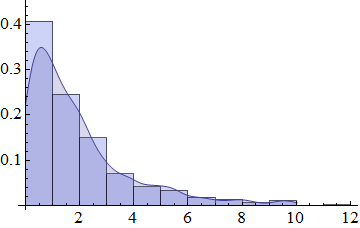
Just to revisit this question, I've found that Karsen 7.'s solution is not always working for me (at least on version 9). Suppose we want to show both a Histogram and a SmoothHistogram. So we try:

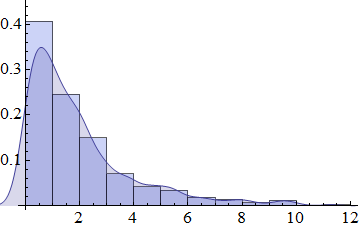
Show[Histogram[data, Automatic, "PDF"], SmoothHistogram[data, Filling -> Bottom]]

And we get the problem as expected.

1

Now we try the PlotRangePadding trick:

Show[Histogram[data, Automatic, "PDF"], SmoothHistogram[data, Filling -> Bottom],
 PlotRange -> {{0, 10}, Automatic}, PlotRangePadding -> 0]

and it doesn't help:

2

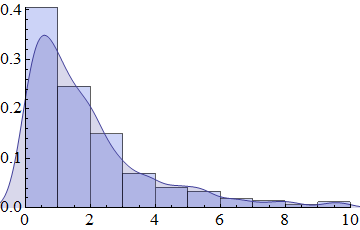
However, using a RegionFunction on the SmoothHistogram:

Show[Histogram[data, Automatic, "PDF"], SmoothHistogram[data, Filling -> Bottom,
  RegionFunction -> Function[{x, y}, 0 <= x <= 10]]]

3

$\endgroup$

Your Answer

By clicking “Post Your Answer”, you agree to our terms of service and acknowledge you have read our privacy policy.

Not the answer you're looking for? Browse other questions tagged or ask your own question.