6
$\begingroup$
 Show[
   Plot[x, {x, 0, 1}, PlotRange -> All], 
   Frame -> True, PlotRange -> {{0, 1}, {0, 1}}, AspectRatio -> 1]

gives the expected result in Mathematica 9
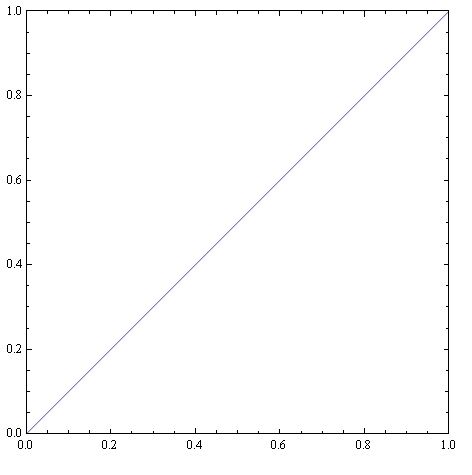
image with correct plot range

but in Mathematica 10.0.1 the plot range is larger than wanted:
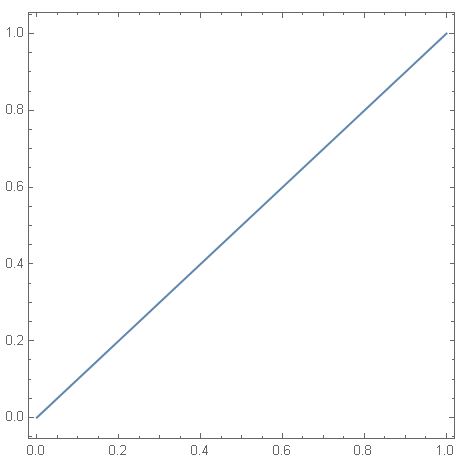
image with too large plot range

Is this a bug?

With

Plot[x, {x, 0, 1}, PlotRange -> {{0, 1}, {0, 1}}, AspectRatio -> 1, Frame -> True]

one gets the with Mathematica 10 the same output as with Mathematica 9.

$\endgroup$
8
  • 4
    $\begingroup$ Nope, if PlotRange is different then line range is different, but it is not the case. What is then?, the algorithm behind PlotRangePadding probably, use PlotRangePadding -> 0 to fix that. $\endgroup$
    – Kuba
    Commented Nov 27, 2014 at 13:43
  • 2
    $\begingroup$ PlotRangePadding->None also works. This is probably no bug, unless the changed behavior of Framed->True was unintentional (who knows). BTW, why not put all options into the Plot call? $\endgroup$
    – Yves Klett
    Commented Nov 27, 2014 at 13:44
  • 1
    $\begingroup$ @YvesKlett: If I use PlotRange inside Plot I do not get the unwanted padding. Only with Show I get this (by me) unexpected behavior. $\endgroup$
    – dnet
    Commented Nov 27, 2014 at 14:07
  • 1
    $\begingroup$ Plot styling was redone in V10 with plot "themes." There have been several changes in the default behavior. No doubt an industrious person could track down all the differences. :) $\endgroup$
    – Michael E2
    Commented Nov 27, 2014 at 14:18
  • 5
    $\begingroup$ Not a bug, just a side effect of an intentional change. $\endgroup$ Commented Nov 27, 2014 at 23:09

1 Answer 1

7
$\begingroup$

The comments to this question answer it fully, but I think we should get a answer on record rather than closing the question as a "simple error" or "easily found in documentation" as neither applies.

Plot styling was [modified] in V10 with plot themes [and in other ways]. There have been several changes in the default behavior. [This is not] a bug, just a side effect of an intentional change.

The PlotRangePadding option can be used to restore the V9 behavior.

PlotRangePadding -> 0

or

PlotRangePadding -> None

will work.

$\endgroup$
1
  • $\begingroup$ To be more specific: The plot range padding of Show[...] has changed in Mathematica 10. Plot[..] seems to be unchanged in this respect. $\endgroup$
    – dnet
    Commented Nov 28, 2014 at 17:13

Your Answer

By clicking “Post Your Answer”, you agree to our terms of service and acknowledge you have read our privacy policy.

Not the answer you're looking for? Browse other questions tagged or ask your own question.