Post Reopened by Mr.Wizard
Post Closed as "Not suitable for this site" by Kuba, Öskå, DumpsterDoofus, Yves Klett, Oleksandr R.
Improved formatting
Source Link
m_goldberg
  • 108.1k
  • 16
  • 104
  • 259

Bug with Unexpected result when using PlotRange in Mathematica 10?

 Show[
  Show[Plot[x Plot[x, {x, 0, 1}, PlotRange -> All], 
   Frame -> True, 
    PlotRange -> {{0, 1}, {0, 1}}, AspectRatio -> 1]

gives the expected result in MathematicaMathematica 9 ![image with correct plot range][1]
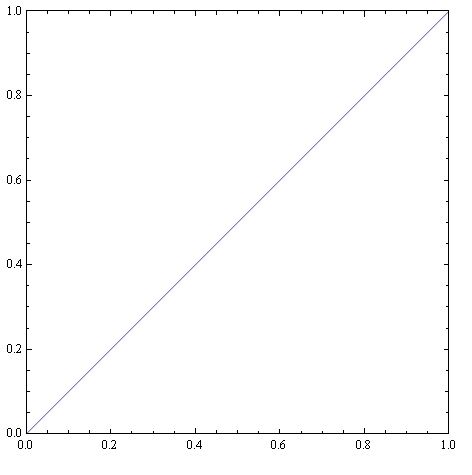
image with correct plot range

but in MathematicaMathematica 10.0.1 the plot range is larger than wanted: ![image with too large plot range][2]
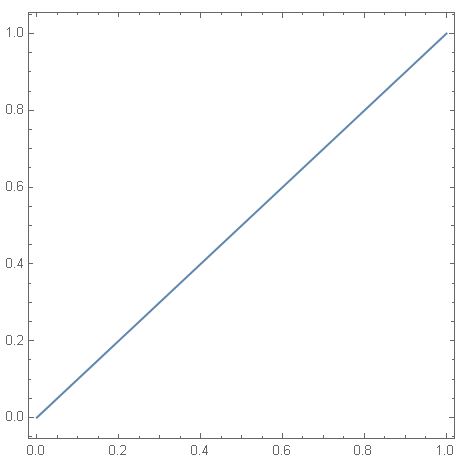
image with too large plot range

Is this a bug?

P.S. WithWith

Plot[x, {x, 0, 1}, PlotRange -> {{0, 1}, {0, 1}}, AspectRatio -> 1, Frame -> True]

one gets the with MathematicaMathematica 10 the same output as with MathematicaMathematica 9. [1]: https://i.sstatic.net/iHn0k.jpg [2]: https://i.sstatic.net/ePls1.jpg

Bug with PlotRange in Mathematica 10?

   Show[Plot[x, {x, 0, 1}, PlotRange -> All], Frame -> True, 
    PlotRange -> {{0, 1}, {0, 1}}, AspectRatio -> 1]

gives the expected result in Mathematica 9 ![image with correct plot range][1]

but in Mathematica 10.0.1 the plot range is larger than wanted: ![image with too large plot range][2]

Is this a bug?

P.S. With

Plot[x, {x, 0, 1}, PlotRange -> {{0, 1}, {0, 1}}, AspectRatio -> 1, Frame -> True]

one gets the with Mathematica 10 the same output as with Mathematica 9. [1]: https://i.sstatic.net/iHn0k.jpg [2]: https://i.sstatic.net/ePls1.jpg

Unexpected result when using PlotRange in Mathematica 10

 Show[
   Plot[x, {x, 0, 1}, PlotRange -> All], 
   Frame -> True, PlotRange -> {{0, 1}, {0, 1}}, AspectRatio -> 1]

gives the expected result in Mathematica 9

image with correct plot range

but in Mathematica 10.0.1 the plot range is larger than wanted:

image with too large plot range

Is this a bug?

With

Plot[x, {x, 0, 1}, PlotRange -> {{0, 1}, {0, 1}}, AspectRatio -> 1, Frame -> True]

one gets the with Mathematica 10 the same output as with Mathematica 9.

edited tags
Link
m_goldberg
  • 108.1k
  • 16
  • 104
  • 259
added 176 characters in body
Source Link
dnet
  • 958
  • 4
  • 12
   Show[Plot[x, {x, 0, 1}, PlotRange -> All], Frame -> True, 
    PlotRange -> {{0, 1}, {0, 1}}, AspectRatio -> 1]

gives the expected result in Mathematica 9 image with correct plot range![image with correct plot range][1]

but in Mathematica 10.0.1 the plot range is larger than wanted: image with too large plot range![image with too large plot range][2]

Is this a bug?

P.S. With

Plot[x, {x, 0, 1}, PlotRange -> {{0, 1}, {0, 1}}, AspectRatio -> 1, Frame -> True]

one gets the with Mathematica 10 the same output as with Mathematica 9. [1]: https://i.sstatic.net/iHn0k.jpg [2]: https://i.sstatic.net/ePls1.jpg

   Show[Plot[x, {x, 0, 1}, PlotRange -> All], Frame -> True, 
    PlotRange -> {{0, 1}, {0, 1}}, AspectRatio -> 1]

gives the expected result in Mathematica 9 image with correct plot range

but in Mathematica 10.0.1 the plot range is larger than wanted: image with too large plot range

Is this a bug?

   Show[Plot[x, {x, 0, 1}, PlotRange -> All], Frame -> True, 
    PlotRange -> {{0, 1}, {0, 1}}, AspectRatio -> 1]

gives the expected result in Mathematica 9 ![image with correct plot range][1]

but in Mathematica 10.0.1 the plot range is larger than wanted: ![image with too large plot range][2]

Is this a bug?

P.S. With

Plot[x, {x, 0, 1}, PlotRange -> {{0, 1}, {0, 1}}, AspectRatio -> 1, Frame -> True]

one gets the with Mathematica 10 the same output as with Mathematica 9. [1]: https://i.sstatic.net/iHn0k.jpg [2]: https://i.sstatic.net/ePls1.jpg

deleted 11 characters in body
Source Link
Yves Klett
  • 15.5k
  • 5
  • 58
  • 125
Loading
Source Link
dnet
  • 958
  • 4
  • 12
Loading