I realize that the Plot function can plot multiple functions of x at the same time, using { }. I also know that the RegionFunction option is used to specify the particular region of the domain that you want plotted. My query is whether I can combine the two together and use different RegionFunctions on different functions of the same parent Plot statement, plotting multiple conditional functions rather than a whole domain:
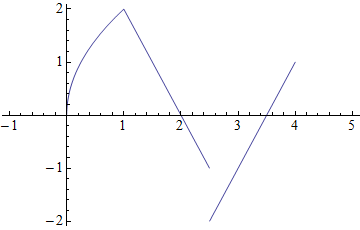
$$f(x) =\begin{cases} 2\sqrt{x} & \text{if } 0\leq x \leq1 \\ 4-2x & \text{if } 1<x<2.5 \\ 2x-7 & \text{if } 2.5 \leq x \leq 4 \end{cases}$$


RegionFunctioncan be used in the same plot $\endgroup$RegionPlot? For example:RegionPlot[{(x + 1)^2 + y^2 < 2, (x - 1)^2 + y^2 < 2}, {x, -3, 3}, {y, -3, 3}]$\endgroup$RegionFunctionCould be used like thePiecewiseFunction $\endgroup$