1
$\begingroup$

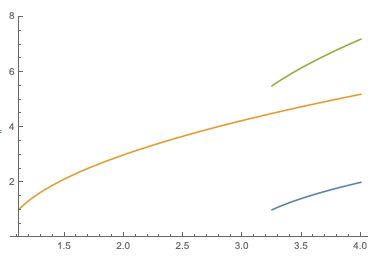
I have two functions (of energy) that are imaginary below different energies. These expressions are quite long and unfortunately, when plotting Re@func, I am left with some trash at low energies. What I want is to add the real parts of these equations and plot them (only add parts with energy greater than the imaginary limit to get rid of the trash). One way I thought of doing it was to plot both functions for only energies greater than imaginary limit 1, and imaginary limit 2. Then add those plots together (not like Show[func1, func2], but actually adding the values of both the functions at a given value together, and then plot the resulting line). Is there a function that does that?

I can illustrate by an example: Lets say we have y1 = x + 2, and we only want this function for x greater than 4. Then we have y2 = 2x + 1, and we want that for x greater than 1. Can this be plotted in a neat way or will I have to make two plots (y2 from x = 1 to 4, and y1+y2 from x = 4) and then combine them using Show?

And another question: If I use Show as suggested above, how can I remove the frame that will will appear at x = 4, but at the same time keep the frame around the entire graph?

$\endgroup$
1
  • 1
    $\begingroup$ Perhaps define the function to be plotted using Piecewise? What do you mean trash at lower energies though? Can you share the expressions? $\endgroup$
    – MarcoB
    Commented Dec 12, 2018 at 13:35

3 Answers 3

2
$\begingroup$
Plot[Piecewise[{{2 x + 1, x < 4 }, {x + 2, x > 4}}], {x, 1, 6}]
$\endgroup$
2
$\begingroup$

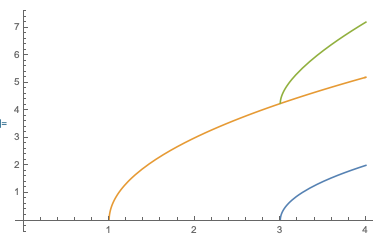
Since Plot doesn't display imaginary values, you can simply plot all functions over the whole range:

f1[z_] := 2 Sqrt[z - 3]

f2[z_] := 3 Sqrt[z - 1]

Plot[{f1[z], f2[z], f1[z] + f2[z]}, {z, 0, 4}]

enter image description here

If you want to explicitly prevent the other parts from being displayed, the following might work:

clean[x_] /; Re[x] > 1 := x
clean[x_] := Indeterminate

Plot[
 {
  clean[f1[z]],
  clean[f2[z]],
  clean[f1[z]] + clean[f2[z]]
  },
 {z, 0, 4},
 PlotRange -> {0, 8}
 ]

enter image description here

This (ab)uses the fact that Plot also doesn't show Indeterminate values, and also the fact that Indeterminate+1 is again Indeterminate, so as soon as one function is not defined, the result will not be plotted. Note that I've used the condition Re[x]>1 instead of Im[x]==0 (which is what you probably want) since the plot would look the same in the case of my example otherwise.

$\endgroup$
2
  • $\begingroup$ Think you are missing the definition of clean here. $\endgroup$
    – SPPearce
    Commented Dec 12, 2018 at 16:34
  • $\begingroup$ @KraZug Thanks for pointing that out, should be fixed now $\endgroup$
    – Lukas Lang
    Commented Dec 12, 2018 at 16:36
0
$\begingroup$

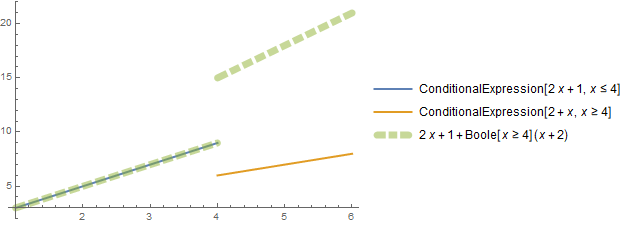
You can also use ConditionalExpression:

Plot[{ConditionalExpression[2 x + 1, x <= 4], 
     ConditionalExpression[2 + x, x >= 4], 
     2 x + 1 + Boole[x >= 4] (x + 2)}, 
 {x, 1, 6}, 
 PlotStyle -> {Thick, Thick, 
    Directive[{Opacity[.5], Dashing[{.03, .01}], CapForm["Round"], AbsoluteThickness[7]}]},
 ImageSize -> Medium, PlotLegends -> "Expressions"]

enter image description here

$\endgroup$

Your Answer

By clicking “Post Your Answer”, you agree to our terms of service and acknowledge you have read our privacy policy.

Not the answer you're looking for? Browse other questions tagged or ask your own question.