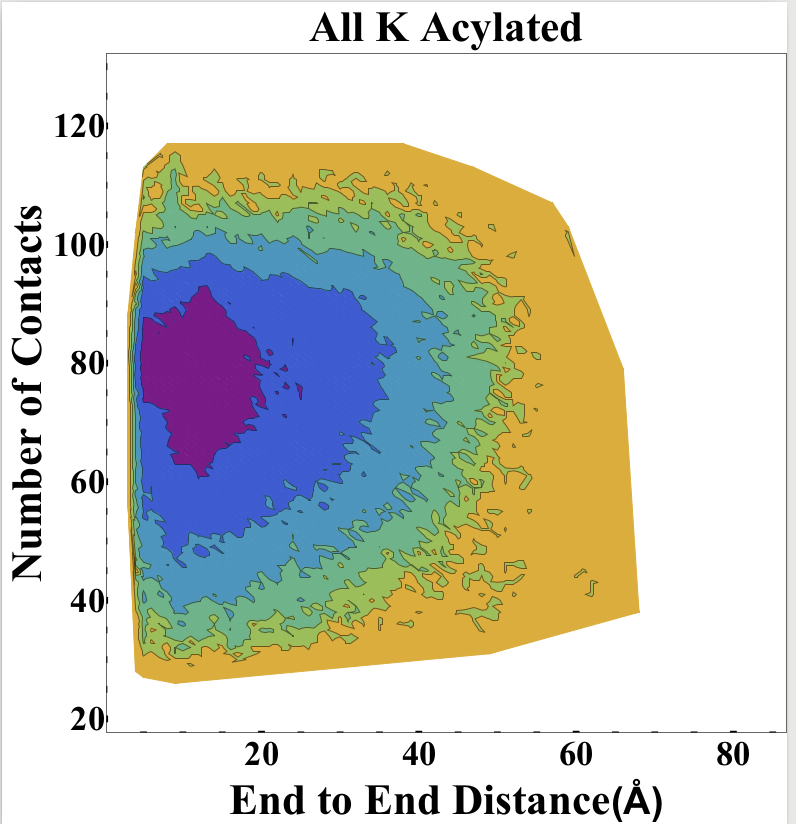
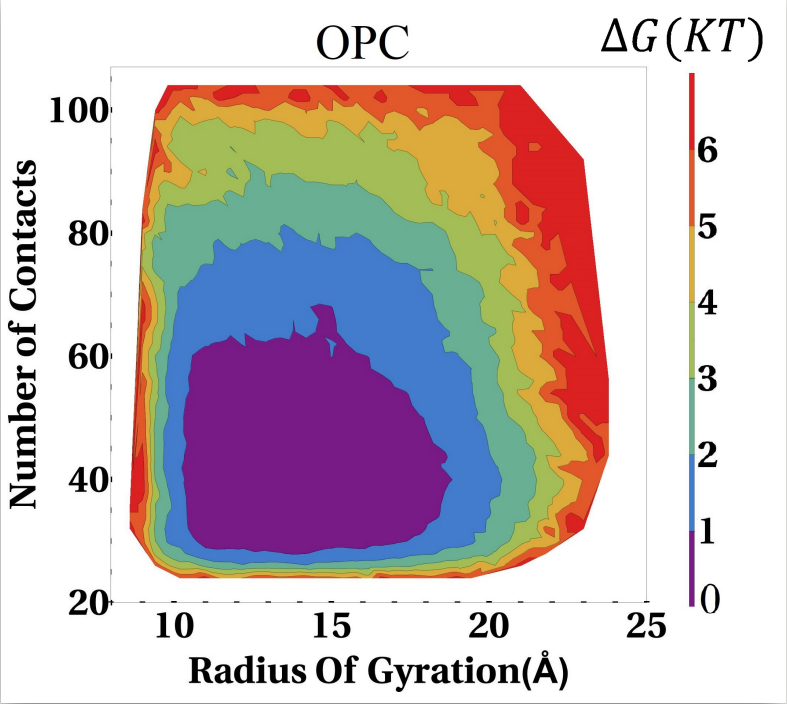
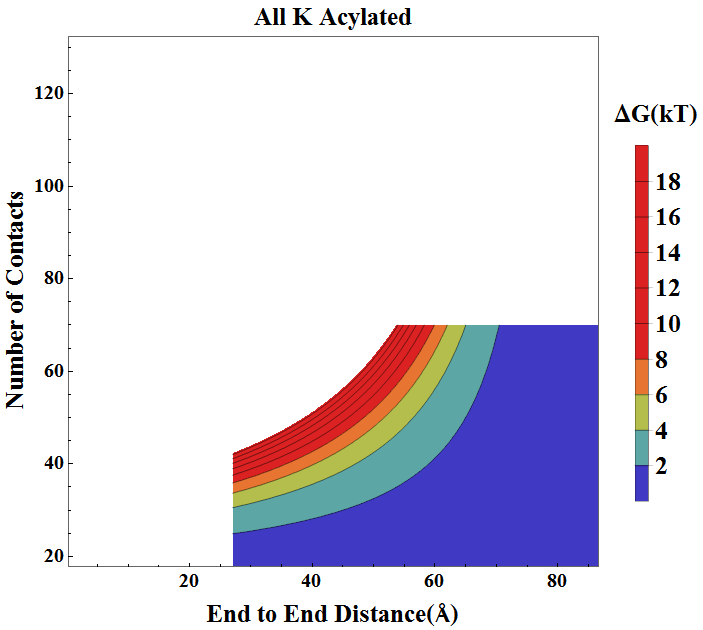
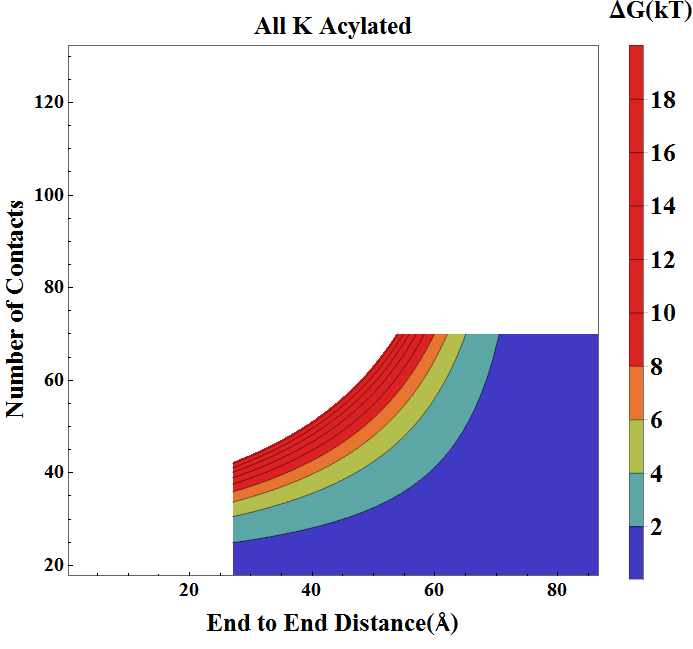
I have a very long code which at the end, I get two plot (main energy plot and energy bar attached pictures). I need these two plots next to each other (for paper). Problem is I can not save the pictures to gather, and they are in two different boxes, and I have to save them one by one then put them together manually. This my code
    ListContourPlot[graphpointogather3d3,
      PlotLegends ->
  BarLegend[Automatic, LegendMarkerSize -> 1550,
   LegendLabel -> "\[CapitalDelta]G(kT)",
   LabelStyle -> {FontSize -> 100, FontFamily -> "Times New Roman",
     Black, Bold}], ColorFunction -> ColorData[{"Rainbow", {0, 8}}],
 ColorFunctionScaling -> False

 , FrameLabel -> {{"Number of Contacts",
    None}, {"End to End Distance(\[Angstrom])", "All K Acylated"}},
 ImageSize -> Full, PlotTheme -> "Scientific",
 Frame -> True, FrameTicks -> {{All, None}, {All, None}},
 FrameTicksStyle -> Directive[Black, 80, Thickness[0.01]],
 LabelStyle ->
  Directive[Black, Bold, FontFamily -> "Times New Roman"],
 RotateLabel -> True,
 BaseStyle -> {FontWeight -> Bold, FontSize -> 100}, AspectRatio -> 1,
  PlotRange -> {{2, 85}, {20, 130}}


 ]
and this the result of the code: the main energy plot

and This the energy bar which I need to be next to the main plot:


