14
$\begingroup$

I realize that the Plot function can plot multiple functions of x at the same time, using { }. I also know that the RegionFunction option is used to specify the particular region of the domain that you want plotted. My query is whether I can combine the two together and use different RegionFunctions on different functions of the same parent Plot statement, plotting multiple conditional functions rather than a whole domain:

$$f(x) =\begin{cases} 2\sqrt{x} & \text{if } 0\leq x \leq1 \\ 4-2x & \text{if } 1<x<2.5 \\ 2x-7 & \text{if } 2.5 \leq x \leq 4 \end{cases}$$

$\endgroup$
8
  • $\begingroup$ Yes it is the answer i was looking for ..... btw what made my question difficult to understand could you edit it . it seems you understood it correctly . $\endgroup$ May 17, 2012 at 10:19
  • $\begingroup$ Btw I also wanted to know wether different RegionFunction can be used in the same plot $\endgroup$ May 17, 2012 at 10:20
  • $\begingroup$ @Mr.Wizard I wasn't asking you to edit your answer. Could you edit my question to make it more clear. $\endgroup$ May 17, 2012 at 10:22
  • $\begingroup$ Have you looked at RegionPlot? For example: RegionPlot[{(x + 1)^2 + y^2 < 2, (x - 1)^2 + y^2 < 2}, {x, -3, 3}, {y, -3, 3}] $\endgroup$
    – Mr.Wizard
    May 17, 2012 at 10:23
  • $\begingroup$ I don't want to plot a region i just wondered if the RegionFunction Could be used like the Piecewise Function $\endgroup$ May 17, 2012 at 10:25

1 Answer 1

23
$\begingroup$

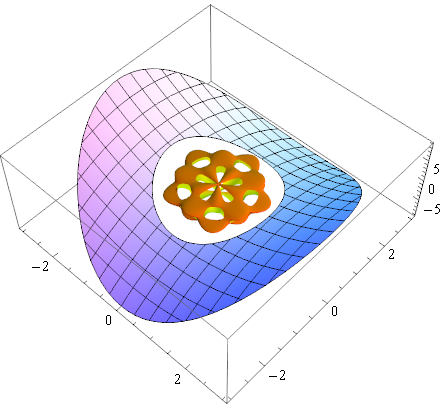
You can use Show to combine graphics of the same type:

g1 = Plot3D[x^2 - y^2, {x, -3, 3}, {y, -3, 3}, 
  RegionFunction -> Function[{x, y, z}, 2 < x^2 + y^2 < 9]];

g2 = SphericalPlot3D[
  1 + Sin[5 θ] Sin[5 φ]/5, {θ, 0, π}, {φ, 0, 2 π}, 
  Mesh -> None, RegionFunction -> (#6 > 0.95 &), PlotStyle -> FaceForm[Orange, Yellow]];

Show[g1, g2]

Mathematica graphics


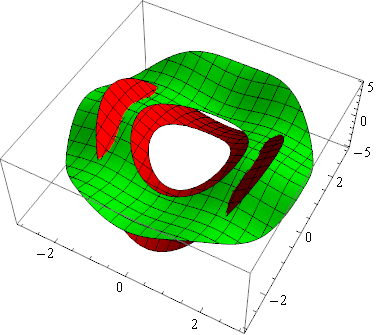
Here is one way that you might construct a compound graphic:

funcs = {x^2 - y^2, Sin[x]^2 + 2 Cos[y]^2};

regions = {Function[{x, y, z}, 1 < x^2 + y^2 < 5], 
           Function[{x, y, z}, 2 < x^2 + y^2 < 9]};

styles = {Red, Green};

MapThread[
  Plot3D[#, {x, -3, 3}, {y, -3, 3}, RegionFunction -> #2, PlotStyle -> #3] &,
  {funcs, regions, styles}
] // Show

Mathematica graphics


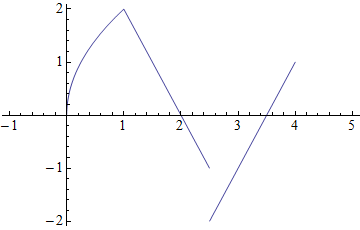
You may also find utility in Piecewise:

pw = Piecewise[{
       {2 Sqrt[x],   0 <= x <= 1  },
       {4 - 2 x  ,   1 <  x <  2.5},
       {2 x - 7  , 2.5 <= x <= 4  }
      }, Indeterminate]

Plot[pw, {x, -1, 5}]

Mathematica graphics

$\endgroup$
5
  • $\begingroup$ I find myself wanting to rotate the graphics, though. To bad we can't post CDF versions of Plot3D and Manipulate. $\endgroup$
    – rcollyer
    May 17, 2012 at 14:54
  • $\begingroup$ @rcollyer what became of LiveGraphics3D? $\endgroup$
    – Mr.Wizard
    May 17, 2012 at 16:08
  • $\begingroup$ Hadn't heard of that before. The last update appears to be in 2008, though. $\endgroup$
    – rcollyer
    May 17, 2012 at 16:12
  • $\begingroup$ @rcollyer it is or was used extensively on MathWorld. At the moment I cannot get anything to load however; it may be a browser issue on my end. $\endgroup$
    – Mr.Wizard
    May 17, 2012 at 16:16
  • $\begingroup$ Probably your browser. The Group Orbit demo seems to work fine for me. $\endgroup$
    – rcollyer
    May 17, 2012 at 16:22

Your Answer

By clicking “Post Your Answer”, you agree to our terms of service and acknowledge you have read our privacy policy.

Not the answer you're looking for? Browse other questions tagged or ask your own question.