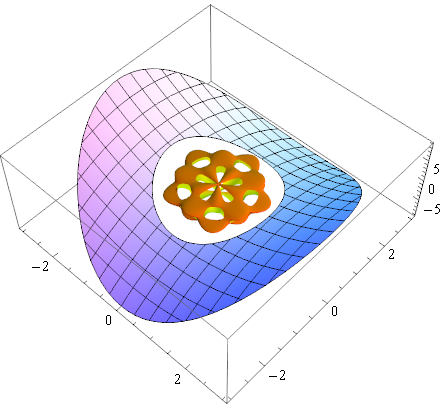
You can use Show to combine graphics of the same type:
g1 = Plot3D[x^2 - y^2, {x, -3, 3}, {y, -3, 3},
  RegionFunction -> Function[{x, y, z}, 2 < x^2 + y^2 < 9]];

g2 = SphericalPlot3D[
  1 + Sin[5 \[Theta]]θ] Sin[5 \[Phi]]φ]/5, {\[Theta]θ, 0, Piπ}, {\[Phi]φ, 0,
   2 Piπ},
  Mesh -> None, RegionFunction -> (#6 > 0.95 &),
  PlotStyle -> FaceForm[Orange, Yellow]];

Show[g1, g2]

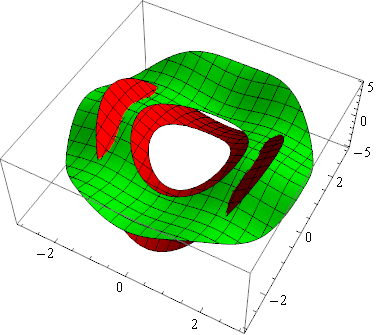
Here is one way that you might construct a compound graphic:
funcs = {x^2 - y^2, Sin[x]^2 + 2 Cos[y]^2};

regions = {Function[{x, y, z}, 1 < x^2 + y^2 < 5],
           Function[{x, y, z}, 2 < x^2 + y^2 < 9]};

styles = {Red, Green};

MapThread[
  Plot3D[#, {x, -3, 3}, {y, -3, 3}, RegionFunction -> #2, PlotStyle -> #3] &,
  {funcs, regions, styles}
] // Show

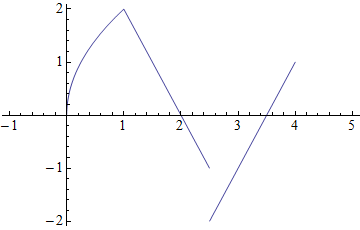
You may also find utility in Piecewise:
pw = Piecewise[{
       {2 Sqrt[x],   0 <= x <= 1  },
       {4 - 2 x  ,   1 <  x <  2.5},
       {2 x - 7  , 2.5 <= x <= 4  }
      }, Indeterminate]

Plot[pw, {x, -1, 5}]

