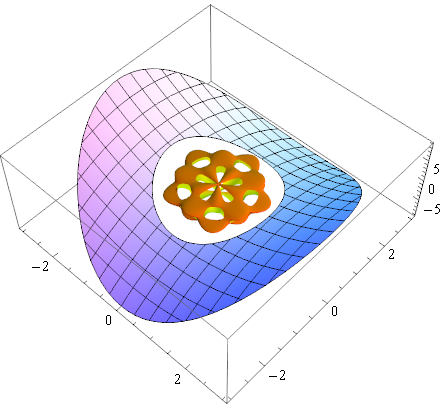
I may not understand your question correctly, but you can use `Show` to combine graphics of the same type:
g1 = Plot3D[x^2 - y^2, {x, -3, 3}, {y, -3, 3},
RegionFunction -> Function[{x, y, z}, 2 < x^2 + y^2 < 9]];
g2 = SphericalPlot3D[
1 + Sin[5 \[Theta]] Sin[5 \[Phi]]/5, {\[Theta], 0, Pi}, {\[Phi], 0,
2 Pi}, Mesh -> None, RegionFunction -> (#6 > 0.95 &),
PlotStyle -> FaceForm[Orange, Yellow]];
Show[g1, g2]

----------
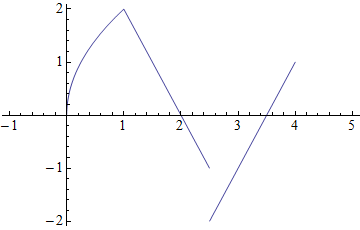
Another interpretation is that you are looking for `Piecewise`:
pw = Piecewise[{
{2 Sqrt[x], 0 <= x <= 1},
{4 - 2 x, 1 < x < 2.5},
{2 x - 7, 2.5 <= x <= 4}
}, Indeterminate]
Plot[pw, {x, -1, 5}]
