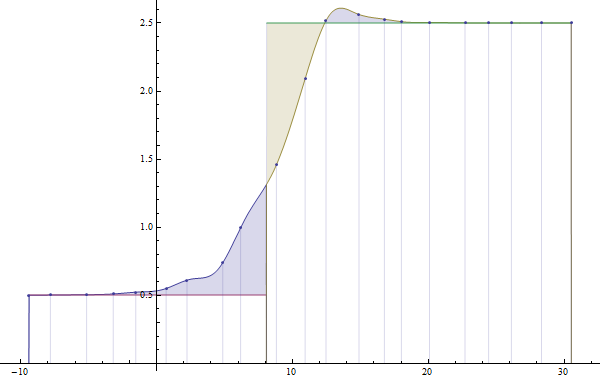
I have discrete collection of data points (10 to 10^4). I want to describe them by a continuous function and find a x value z, where areas S1 and S2 bounded by {x, f[x], yBot, yTop} are equal. Furthermore, I think it is called Matano plane.
There is 1 important special case: if function values dips beyond {yBot, yTop}, then that area should be added to the other area.
Shaded regions on this plot should be equal (S1=blue,S2=yellow):

Example data for this plot: n = 3; and z is the divider what I am looking for
rc = RandomChoice[{Sech[2 x - 0.5]/1.5 + 1.5, 2}]
data = Transpose[{
   # + RandomReal[] & /@ Range[-10, 30, 2],
   Tanh[#] + rc /. x -> # & /@ Range[-4, 4, 0.4]}]
f = GetRLine3[{data}, 3][x];
{xLimits, yLimits} = {
  {Min@#1, Max@#1},
  {Mean@#2[[1 ;; n]], Mean@#2[[-n ;; -1]]}} & @@ Transpose[data]
Where GetRLine3 is:
GetRLine3[MMStdata_, IO_: 1][x_: x] :=ListInterpolation[#, InterpolationOrder -> IO,
  Method -> "Spline"][x] & /@ (({{#[[1]]}, #[[2]]}) & /@ # & /@ MMStdata);
I can write a adhoc solution that finds z, but then it takes about 5.953s to find.
z = step = xLimits[[1]] + (xLimits[[2]] - xLimits[[1]])/2;
While[{part1, part2} = Flatten[{Integrate[f - yLimits[[1]], {x, xLimits[[1]], z}],
     -Integrate[(f - yLimits[[2]]), {x, z, xLimits[[2]]}]}] // N; part1 != part2,
 If[part1 > part2, step /= 2; z -= step, step /= 2; z += step]]
In this case z=8.075996010318093.
I can't seem to be able to use solve to find z. I have tried other regression curves
Fit withTable[x^k,{k,0,100}]NonlinearModelFitwitha/2 Erf[(x-μ)/(Sqrt[2]σ)]+y0
and they are about 10x faster, but they did't work for both small and large sets of data. Finding accurate model or set of functions seems to be beyond me.
Is there a better or faster way to solve for z in range xLimits.
