Code is:
m[t_] := {mx[t], my[t], mz[t]}

γ = 28;

h = 6.62*10^-34;

e = 1.6*10^-19;

Subscript[μ, 0] = 1.25*10^-6;

Subscript[μM, 0] = 800*10^-3;

Subscript[M, 0] = 0.64*10^6;

Subscript[r, 0] = 100*10^-9;

Subscript[l, 0] = 3*10^-9;

Subscript[I, dc] = 1*10^-3;

Subscript[B, dc] = 200*10^-3;

Subscript[α, G] = 0.01;

p = {0, 0, 1};

σ =(γ*h/2*e)*1/(Subscript[M, 0]*Pi*(Subscript[r, 0])^2)*Subscript[l, 0];

Subscript[B, eff] = {Subscript[B, dc], 0, 0}-Subscript[μM, 0]*(m[t]*p);

system1 ={D[m[t], t] ==γ*(Cross[Subscript[B, eff], m[t]]) + Subscript[α, G]*(Cross[m[t], D[m[t], t]]) +σ*Subscript[I, dc]*(Cross[m[t], Cross[m[t], p]]),(m[t] /. t -> 0) == {0, 1, 0}};

s1 = NDSolve[system1, m[t], {t, 0, 50}]

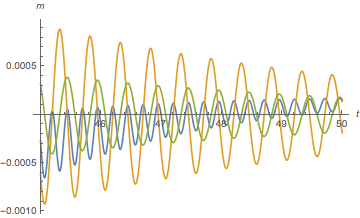
Plot[Evaluate[{mx[t], my[t], mz[t]} /. s1], {t, 0, 50},AxesLabel -> {t, m}]

Plot[Evaluate[mx[t] /. s1], {t, 0, 50}, AxesLabel -> {t, mx}]
I need for mx (t) calculate how changes the magnetization of the oscillation frequency f 0 during the time of 50 ns and plot a graph f (t).


{}button above the edit window. The edit window help button?is also useful for learning how to format your questions and answers. You may also find this meta Q&A helpful $\endgroup$WhenEvent): (40122), (106006), (127095) $\endgroup$