2
$\begingroup$

I have a diagram with seven curves (each with a different parameter). My goal is to find a function for the family of curves (i.e. a single function not just for the seven parameters, but for all parameters in between).

The values are between 0.3 and 2.0. I manually got the values in 0.1 steps.

These are the points I got:

f50 = {{0.3, 360}, {0.4, 315}, {0.5, 280}, {0.6, 250}, {0.7, 225}, {0.8, 200}, 
{0.9, 180}, {1.0, 165}, {1.1, 150}, {1.2, 135}, {1.3, 125}, {1.4, 115}, 
{1.5, 105}, {1.6, 97}, {1.7, 93}, {1.8, 88}, {1.9, 85}, {2.0, 84}}

f100 = {{0.3, 426}, {0.4, 382}, {0.5, 347}, {0.6, 316}, {0.7, 291}, {0.8, 268},
{0.9, 249}, {1., 231}, {1.1, 216}, {1.2, 203}, {1.3,191}, {1.4, 182},
{1.5, 172}, {1.6, 165}, {1.7, 160}, {1.8, 156}, {1.9, 153}, {2., 152}}

f150 = {{0.3, 600}, {0.4, 547}, {0.5, 497}, {0.6, 454}, {0.7, 415},
{0.8, 380}, {0.9, 352}, {1., 326}, {1.1, 305}, {1.2, 287}, {1.3, 272},
{1.4, 260}, {1.5, 250}, {1.6, 242}, {1.7, 236},{1.8, 232}, {1.9, 230},
{2., 229}}

f200 = {{0.3, 750}, {0.4, 683}, {0.5, 625}, {0.6, 574}, {0.7, 530}, {0.8, 490},
{0.9, 456}, {1., 426}, {1.1, 400}, {1.2, 380}, {1.3, 358}, {1.4, 343},
{1.5, 330}, {1.6, 320}, {1.7, 310}, {1.8, 305}, {1.9, 302}, {2., 300}}

f250 = {{0.4, 900}, {0.5, 814}, {0.6, 740}, {0.7, 677}, {0.8, 622}, {0.9, 575},
{1., 535}, {1.1, 500}, {1.2, 471}, {1.3, 446}, {1.4, 425}, {1.5, 408},
{1.6, 395}, {1.7, 386}, {1.8, 380}, {1.9, 374}, {2., 372}}

f275 = {{0.7, 870}, {0.8, 785}, {0.9, 707}, {1., 642}, {1.1, 587}, {1.2, 542},
{1.3, 506}, {1.4, 476}, {1.5, 453}, {1.6, 435}, {1.7, 422}, {1.8, 413},
{1.9, 408}, {2., 405}}

f300 = {{0.9, 915}, {1., 827}, {1.1, 741}, {1.2, 671}, {1.3, 616}, {1.4, 573},
{1.5, 540}, {1.6, 510}, {1.7, 487}, {1.8, 467}, {1.9, 453}, {2., 440}}

I found several functions, that fit one particular curve quite well. What is the next step to find a function for the family of curves for values of x between 0.3 and 2.0?

I didn’t find anything online for this problem, but I admit, that I may not know the appropriate words for a search.
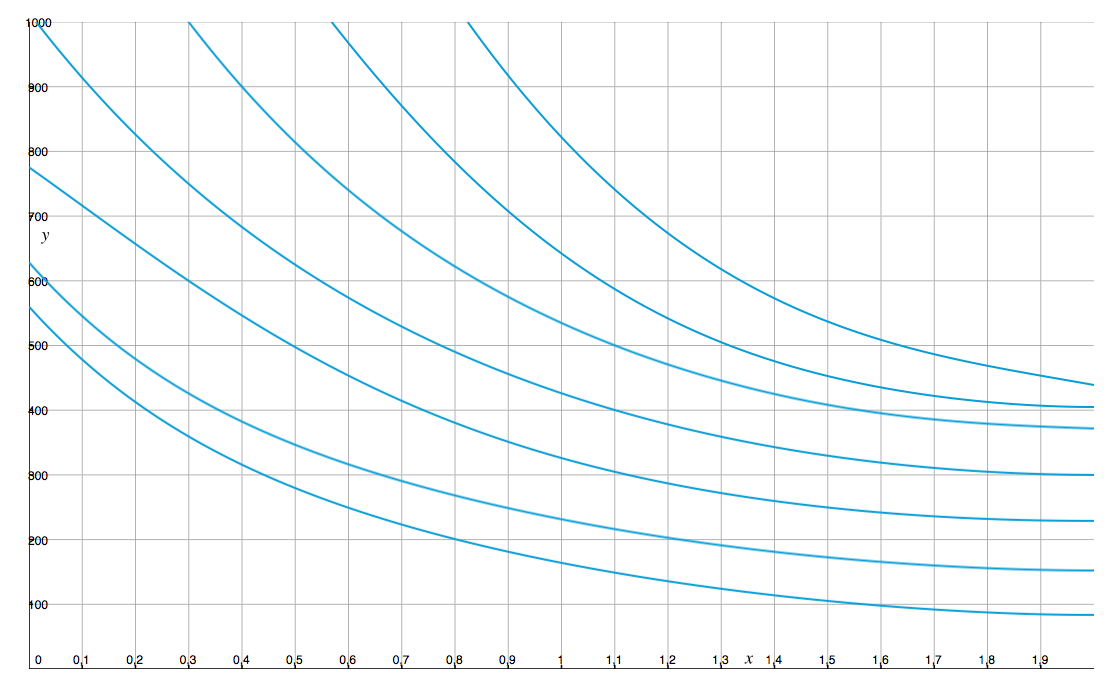
These are the seven curves I plotted and have the functions for. The parameters are from bottom to top: 5,10,15,20,25,27.5,30. How do I find a function with the parameter? These are the seven curves I plotted and have the functions for. The parameters are from bottom to top:

50, 100, 150, 200, 250, 275, 300

How do I find a function with the parameter?

$\endgroup$
4
  • $\begingroup$ Welcome to Mathematica.SE! I suggest the following: 1) As you receive help, try to give it too, by answering questions in your area of expertise. 2) Take the tour! 3) When you see good questions and answers, vote them up by clicking the gray triangles, because the credibility of the system is based on the reputation gained by users sharing their knowledge. Also, please remember to accept the answer, if any, that solves your problem, by clicking the checkmark sign! $\endgroup$
    – Michael E2
    Commented Feb 3, 2016 at 0:27
  • $\begingroup$ You seem to have given data for only one of the seven curves. Unless somebody knows a ready-made solution for such a problem, I think data for the other curves will be needed to test potential models. Also, did you mean there is one parameter with seven different settings, each yielding a curve? $\endgroup$
    – Michael E2
    Commented Feb 3, 2016 at 0:33
  • 1
    $\begingroup$ I have the data for all seven curves (in the question, I wrote just the data for one curve as an example). And yes, the diagram shows one curve, each for a different values of a parameter. $\endgroup$ Commented Feb 3, 2016 at 0:43
  • $\begingroup$ Do you actually need the formula for the function (that seems hard, because there's no obvious parametric relationship between these curves based on what the graphs look like). Would an InterpolatingFunction work? i.e. is it okay to have a numerical function that gives the curves defined by the data plus a smooth interpolation between those curves? $\endgroup$
    – march
    Commented Feb 3, 2016 at 4:24

1 Answer 1

3
$\begingroup$

If you wish to find a formula for a set of data, you could use the FindFormulafunction:

values = {{0.3, 360}, {0.4, 315}, {0.5, 280}, {0.6, 250}, 
          {0.7, 225}, {0.8, 200}, {0.9, 180}, {1.0, 165}, 
          {1.1, 150}, {1.2, 135}, {1.3, 125}, {1.4, 115}, 
          {1.5, 105}, {1.6, 97}, {1.7, 93}, {1.8, 88}, 
          {1.9, 85}, {2.0, 84}};
FindFormula[values, x]

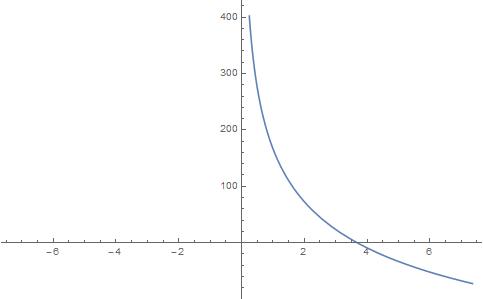
(* -560.276969594193` + (726.9849713264147`/(x^0.2`)) *)

Plot[-560.277 + 726.985/x^0.2, {x, -7.35603, 7.35603}]

graph

EDIT

The question has changed and requires some adjustments.

Because of the ~abstract~ nature of the question, I figured this might be a fun time for some machine learning.

First, I'm going to borrow @Xavier's parametric fit from the comments (thanks!), while assigning the inputs to the results:

trainingSet = 
 Flatten[{#[[1]] -> {k, a, b, c} /. 
      FindFit[#[[2]], k a x^2 + k b x + k*c, {k, a, b, c}, x]}
       & /@ {{50, f50}, {100, f100}, {150, f150}, {200, f200}, 
             {250, f250}, {275, f275}, {300, f300}}]

(*{50 -> {5.22054, 20.7143, -76.5871, 87.5835}, 
   100 -> {8.18377, 13.2549, -48.8544, 64.0041}, 
   150 -> {9.83363, 16.7709, -59.5746, 76.3585}, 
   200 -> {14.5865, 12.838, -46.6688, 63.2554}, 
   250 -> {13.6602, 18.8301, -67.8033, 88.5712}, 
   275 -> {10.4912, 33.4334, -122.605, 151.243}, 
   300 -> {15.6073, 26.3044, -102.673, 129.094}} *)

Then we feed this into a predictor function:

pf = Predict[trainingSet, Method -> "NeuralNetwork", 
       PerformanceGoal -> "Quality"];

Now we can explore what these relationships look like:

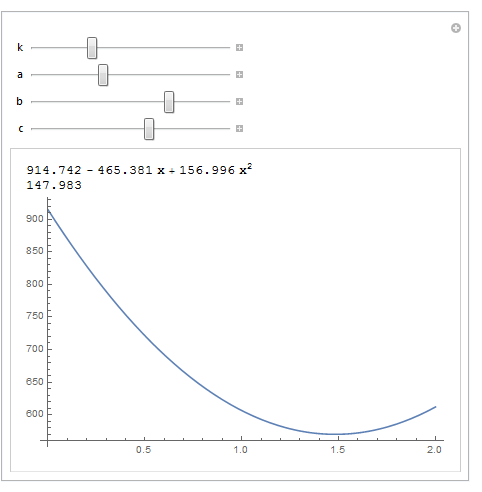
Manipulate[
 TableForm@{k a x^2 + k b x + k*c, cf[{k, a, b, c}], 
   Plot[(k a x^2 + k b x + k*c ), {x, 0, 2}]}, {k, 5, 15}, {a, 11, 35}, 
    {b, -102, -40}, {c, 60, 150}]

Neural2

$\endgroup$
4
  • $\begingroup$ Thank you for your prompt answer. I did use the FindFormula function to find the formulas for the seven curves. But now I want to find a parametric function (not sure if this is the correct expression) for these seven formulas. A FindFormula for the found formulas to to say. I am looking for something like this: y = kax^2 + kbx + k*c where k is the parameter (from which I have seven from the original diagram) and a, b and c are some constants. $\endgroup$ Commented Feb 3, 2016 at 0:16
  • 2
    $\begingroup$ @user37427 What about FindFit[data, k a x^2 + k b x + k*c, {k, a, b, c}, x], where data is your list of values? $\endgroup$
    – user31159
    Commented Feb 3, 2016 at 0:22
  • $\begingroup$ @Xavier Let’s say I have the two functions f(y)=5x and g(y)=10x. I need to find the function p(y)=kx, so that I get f(y) with k=5 and g(y) with k=10 and also functions with other values for k. I am looking for a approximation that is good enough between a specific range ([0.3;2.0] that is). $\endgroup$ Commented Feb 3, 2016 at 0:37
  • $\begingroup$ @Xavier I like it- incorporated this fit into my edits $\endgroup$ Commented Feb 3, 2016 at 18:01

Your Answer

By clicking “Post Your Answer”, you agree to our terms of service and acknowledge you have read our privacy policy.

Not the answer you're looking for? Browse other questions tagged or ask your own question.