0
$\begingroup$

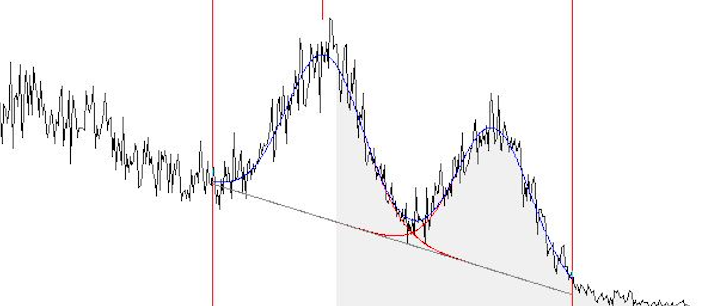
I wanted to fit two gaussian and linear curves, I tried to use nonlinear model fit, but I'm making somewhere a mistake.

I know that one gaussian curve can be fitted as

nlm1 = NonlinearModelFit[N@ToExpression[data], 
   a1*E^(-((x - max)^2/(2*b1^2))) + b1*x + c1, {a1, b1, c1}, x];

I wanted to get something like this: enter image description here

How it should be done?

$\endgroup$
2
  • 2
    $\begingroup$ Please post your data and some code about such figure. $\endgroup$
    – cvgmt
    Commented Nov 6, 2021 at 0:42
  • $\begingroup$ Welcome! To make the most of MMA.SE start by taking the tour now. It will help us to help you if you write an excellent question. In particular, don't make us guess what you have tried, please edit your question to include a minimal working example of the code you are using. Please use formatted form. As you receive give back, vote and answer questions, keep the site useful, be kind, correct mistakes and share what you have learned. $\endgroup$
    – LouisB
    Commented Nov 6, 2021 at 0:42

1 Answer 1

4
$\begingroup$

Your data looks like it could be described with a linear trend plus two gaussian-shaped curves requiring 8 parameters: 2 for the linear trend and 3 for each gaussian-shape. Your code only allows for the linear trend and one gaussian shape.

Here is some made-up data roughly in the form of what you show:

x = Range[1000]/1000;
parms = {a1 -> 0.7, a2 -> -0.6, a3 -> 0.5, a4 -> 0.04, a5 -> 0.5, 
   a6 -> 0.4, a7 -> 0.03, a8 -> 0.75};
y = (a1 + a2 x + a3 Exp[-(x - a5)^2/(2 a4^2)] + 
      a6 Exp[-(x - a8)^2/(2 a7^2)] /. parms) +
   RandomVariate[NormalDistribution[0, 0.05], 1000];
data = Transpose[{x, y}];
ListPlot[data, AspectRatio -> 1/2, Joined -> True, ImageSize -> Large]
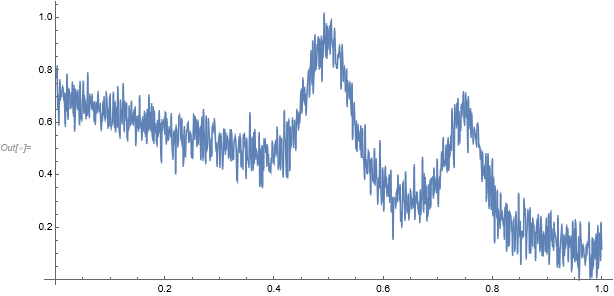
Fake data

To get appropriate results from NonlinearModelFit you'll need to reasonable starting values for the gaussian shape parameters which you can get from looking at your data.

nlm = NonlinearModelFit[data, 
   a1 + a2 z + a3 Exp[-(z - a5)^2/(2 a4^2)] + a6 Exp[-(z - a8)^2/(2 a7^2)],
   {a1, a2, a3, {a4, 0.05}, {a5, 0.5}, a6, {a7, 0.1}, {a8, 0.7}}, z, MaxIterations -> 1000];
nlm["ParameterTable"]
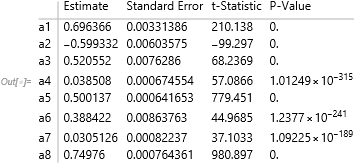
enter image description here

Show[ListPlot[data, AspectRatio -> 1/2, ImageSize -> Large], 
 Plot[nlm[z], {z, 0, 1}, PlotStyle -> Red]] 
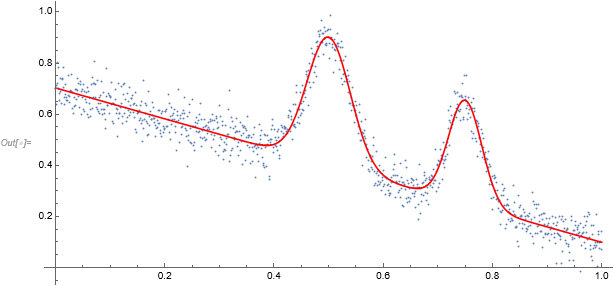
Data and fit

But you'll need to look at the residuals to see if you're missing something in the error structure such as a non-constant variance or serial correlation.
$\endgroup$

Your Answer

By clicking “Post Your Answer”, you agree to our terms of service and acknowledge you have read our privacy policy.

Not the answer you're looking for? Browse other questions tagged or ask your own question.