1
$\begingroup$

I have data points — denoted by Fk— covering quite a large range $(1,\,10^{1010})$. I plotted them with ListLogPlot. Then I tried to fit the data points using NonlinearModelFit, and now I have two problems:

  1. Fitting the data points

    fit = NonlinearModelFit[Fk[300], a*k^(B*k), {a, B}, k] 
    

    gives 1 k^1 for the fitted model.

    However, fitting the data points with:

    fit2 = NonlinearModelFit[Fk[300], a*k^(b*c*k), {a, b, c}, k] 
    

    gives the fitted model 140.714 k^1.16997 k which I completely do not unterstand. I mean why should the output change upon inserting the variable $c$, which could also be combined with $b$ such that say $b\,c= B$ and fit should be equal to fit2.

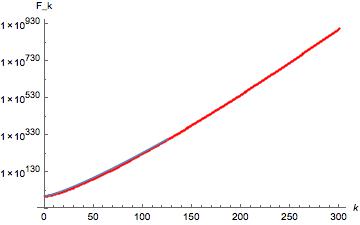
  2. If I now plot the data Fk vs. k together with the fitted model, the fitted curve ends at some value of $k \approx 120$, and I do not unterstand why. My code for this is

    Show[{ListLogPlot[Fk[300], PlotStyle -> Red], LogPlot[fit2[k], {k, 0, 300}]}]
    

plot

Red dots = data points; blue line = fitted curve

$\endgroup$
10
  • $\begingroup$ Thanks, is it now ok? $\endgroup$
    – user46908
    Commented Feb 26, 2017 at 13:03
  • $\begingroup$ Yes, I will delete my comment. $\endgroup$
    – m_goldberg
    Commented Feb 26, 2017 at 13:05
  • $\begingroup$ Can you provide us with your points? (Btw it makes no sense to fit b*c since they're directly correlated into each other.) $\endgroup$ Commented Feb 26, 2017 at 14:13
  • $\begingroup$ For the fact that the plot stops at a value around k=120, that may be because your function is hitting the upper limit of machine-precision numbers. See (105774). Try increasing the WorkingPrecision for your Plot function. $\endgroup$
    – MarcoB
    Commented Feb 26, 2017 at 15:49
  • $\begingroup$ Non-linear fitting rarely plug-and-play. Two things I would recommend: (i) Find a good initial guess for the parameters. E.g., a=Fk[0]. (ii) If the fit is 1% off at k=300 the absolute error is $10^{800}$ times larger than a 1000% error at k=50. That is, you probably want to specify weights to be some function of Fk. Finally, plotting works with Exclusions -> None, see this bug. $\endgroup$
    – Felix
    Commented Feb 26, 2017 at 16:20

1 Answer 1

4
$\begingroup$

You want to fit the log of Fk[300] and add in some constraints for the parameters.

Fk[n_] := LinearSolve[
   Table[PadRight[Table[StirlingS2[k, m], {m, k}], n], {k, 1, n}], 
   Table[BellB[k]^2, {k, 1, n}]];
data = Transpose[{Range[1, 300], Log[Fk[300]]}];

nlm = NonlinearModelFit[data, {Log[a] + b k Log[k], a > 0 && b > 0}, {a, b}, k];
nlm["BestFitParameters"]
(* {a -> 74145.49180618675`,b -> 1.1879871492270795`} *)

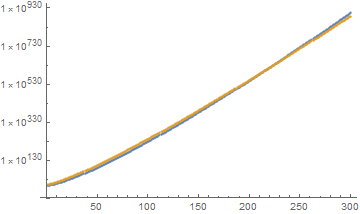
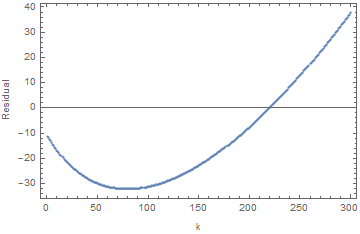
But this doesn't provide a great fit. (Or rather if you add in a few more terms, you can predict a whole lot better. But that's not a Mathematica issue.)

ListLogPlot[{Fk[300], Exp[nlm["PredictedResponse"]]}]

Fit using logs

Here is a "close-up" of the lack of fit showing the residual associated with the values of k: Residuals vs k

$\endgroup$
4
  • $\begingroup$ Hi Jim. Thanks for your answer. I now used your NonlinearModelFit however I got a different a and b: {a -> 1.70003*10^-6, b -> 1.20435} $\endgroup$
    – user46908
    Commented Feb 27, 2017 at 7:03
  • $\begingroup$ And yes, you are right it is not the best fit. I will try to make it better, but what I am looking for is just an asymptotic behaviour of the Fk, thus from the fit I already kind of see what to expect. $\endgroup$
    – user46908
    Commented Feb 27, 2017 at 7:13
  • $\begingroup$ Using loga as the parameter rather than a in Log[a] gives a number much closer to yours and (maybe more importantly) gives a smaller error variance. However, if your objective is to estimate asymptotic behaviour and you're not so interested in small values of k, then that probably doesn't help much. $\endgroup$
    – JimB
    Commented Feb 27, 2017 at 17:06
  • $\begingroup$ Yeah I realized that even for getting just an asymptotic behaviour my fit was far too bad, thus I changed the model to ak^(bk^c). Now the fit is much better and the residuals pretty small. Thanks again for your answer. $\endgroup$
    – user46908
    Commented Feb 28, 2017 at 7:04

Your Answer

By clicking “Post Your Answer”, you agree to our terms of service and acknowledge you have read our privacy policy.

Not the answer you're looking for? Browse other questions tagged or ask your own question.