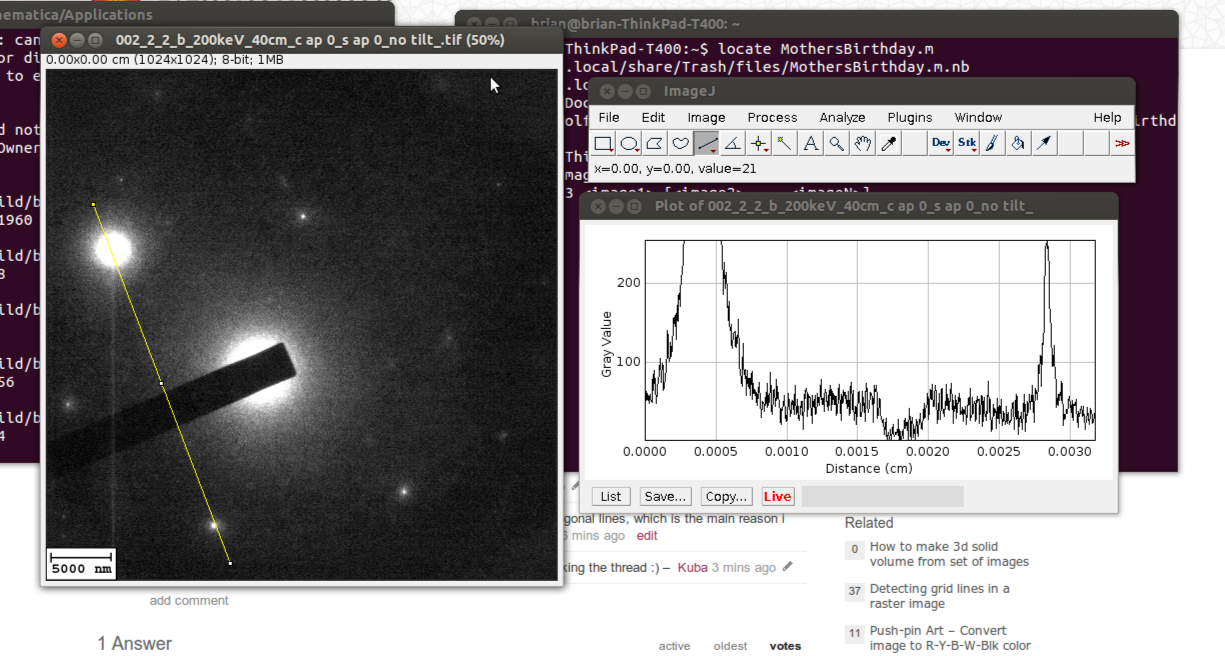
I can get line profiles from images using imagej but it would be nice to be able to do this in my mathematica notebooks.
I found this
http://library.wolfram.com/examples/intensityprofiles/
after some google searches and it is exactly what I want to be able to do. However it seems they removed this package. I cant seem to figure out how to do this in v 9.0.
Anyone know how to do this?
Edit: I added a picture to make it more clear what I'm talking about. Its important that I can take an arbitrary (diagonal) line and that mathematica interpolates between pixels in a way that makes sense.
Sorry if my formatting is off, this is my first post.

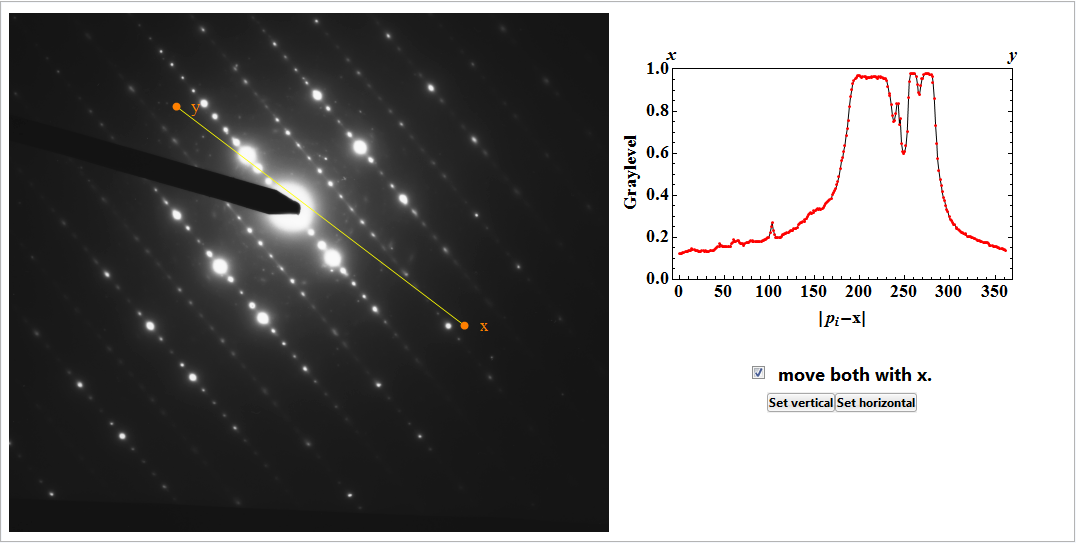
UPDATE: This is what I think I'm going to use to do what I want. Obviously the display isn't made, and details need to be sorted out, but ImageValue interpolates automatically and seems like the Built-In to use. Thanks for the help everyone.
  img = Import["http://i.imgur.com/szcChXh.png?1"]
    (*First Argument of ImageProfile is the arc length along the line profile,
    incremented in steps of 1/(npts-1)*)
    (*Second Argument of ImageValue is the parametric form of a line, incremented in
    steps of 1/(npts-1)*)

    ImageProfile[img_, x1_, y1_, x2_, y2_, npts_] :=
     Table[{N@((i - 1)/(npts - 1)) Sqrt[(x1 - x2)^2 + (y1 - y2)^2],
       ImageValue[
        img, {x1 + (x2 - x1) (i - 1)/(npts - 1),
         y1 + (y2 - y1) (i - 1)/(npts - 1)}]}, {i, 1, npts}]
    pt1 = {500, 300};
    pt2 = {600, 600};
   Show[img, Graphics[{Red, Thick, Line[{pt1, pt2}]}]]
    ListPlot[ImageProfile[img, pt1[[1]], pt1[[2]], pt2[[1]], pt2[[2]],1000], Joined -> True]

