5
$\begingroup$

UPDATE to the question

I have reformulated the question in order to make it distinct from the one suggested as a duplicate: "Line Intensity Profile From Image." The key difference is that I'm interested in obtaining a pixel profile where the PixelValues are placed according to their distances from the ends of the Line and no interpolation of PixelValues is allowed. The referenced thread does not contain a suitable solution and does not imply these restrictions.


The basic question

I find quite interesting this recent question on the Wolfram Community for which I wish to find a more efficient and general solution than the one I have at the moment.

The general problem: having a raster Image what is an efficient way to find the PixelValues profile along a straight Line (of thickness 1 pixel) defined by two points in the standard coordinate system of the image? My current approach requires creation of a rasterized version of a Graphics object containing Line what is very inefficient when the original image is large. Probably the best approach to the problem would be to implement an algorithm which allows to generate pixel positions in the original image along the Line without using the FrontEnd.

The following is my inefficient solution via Rasterize:

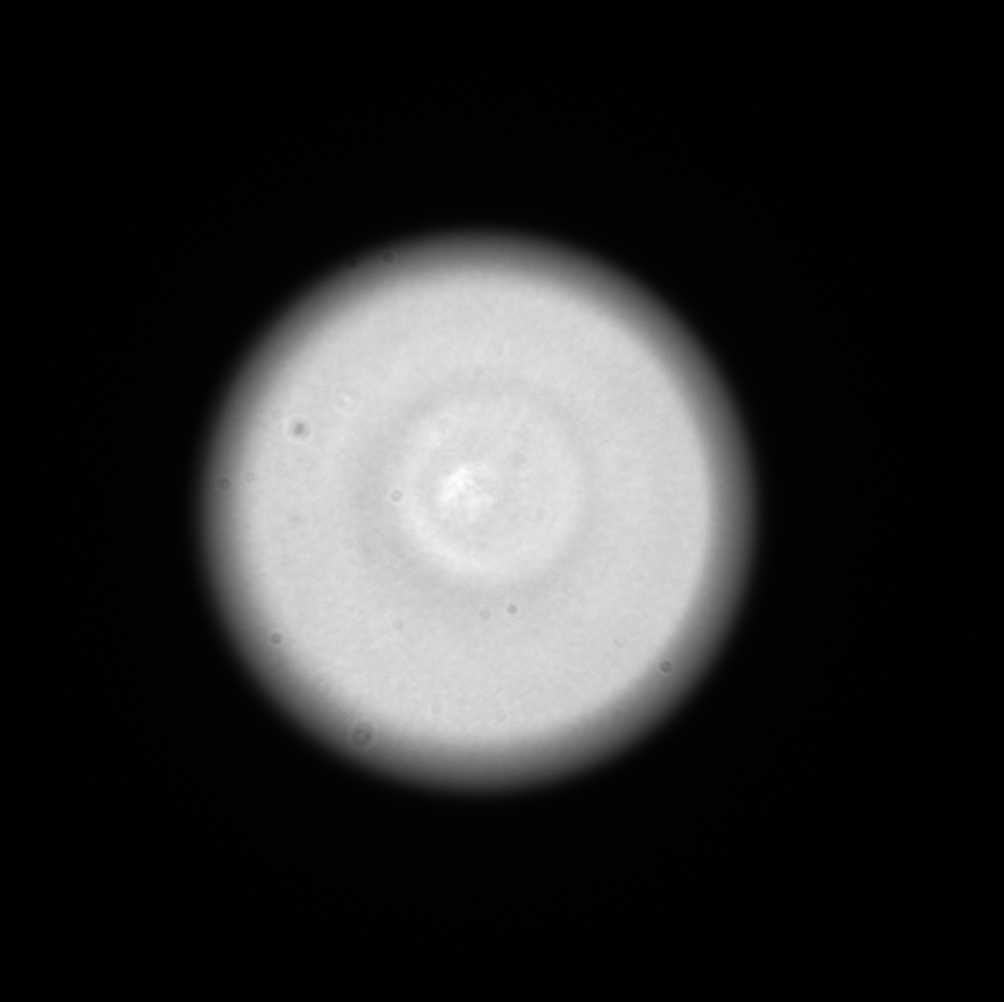
img = Import["https://i.sstatic.net/Tc8hR.png"]

image

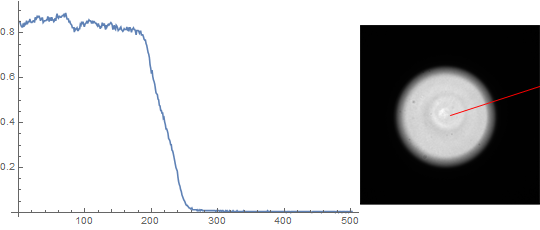
Here we find the variation of brightness along the radial profile defined via angle α.

α = Pi/10;
id = ImageDimensions[img];
pr = {0, #} & /@ id;
center = Round[Mean /@ pr];
gr = Graphics[{White, AbsoluteThickness[1], 
    Line[{center, AngleVector[center, {Norm[id], α}]}]}, Background -> Black, 
   PlotRangePadding -> None, ImageSize -> id, PlotRange -> pr, AspectRatio -> Automatic];
mask = Binarize@Rasterize[Style[gr, Antialiasing -> False], "Image"];
radialProfile = 
  PixelValue[img, SortBy[PixelValuePositions[mask, 1], N@EuclideanDistance[center, #] &]];
Length@radialProfile
Row[{ListLinePlot[radialProfile, ImageSize -> Medium], 
     Show[img, gr /. White -> Red, ImageSize -> Small]}]
502

output

$\endgroup$
5
  • $\begingroup$ @AlexeyPopkov You can replace it in my code. I was going to do this but I waas to lazy/run out of time :) $\endgroup$
    – Kuba
    Commented Oct 3, 2015 at 10:29
  • $\begingroup$ I just realized that I posted more or less the same answer here that I posted to the question @Pickett linked. So yes, I think this is a duplicate, too... $\endgroup$ Commented Oct 3, 2015 at 10:43
  • $\begingroup$ What do you mean by "according to their distances"? If you mean "equidistant", then I don't see how that's possible without interpolation, unless the line has 0°, 90° or 45° angle. To prevent further confusion, could you add code to your answer, that calculates the X/Y coordinates you want to sample? (even if it's inefficient) $\endgroup$ Commented Oct 3, 2015 at 18:14
  • $\begingroup$ @nikie I added an example to my answer. I don't mean equidistant, only the ability to calculate the distance between pixels and the line ends (the center for the case of radial profile). $\endgroup$ Commented Oct 3, 2015 at 18:22
  • $\begingroup$ Strongly related: mathematica.stackexchange.com/q/4436/280 $\endgroup$ Commented May 3, 2017 at 12:01

2 Answers 2

5
$\begingroup$

Probably the best approach to the problem would be to implement an algorithm which allows to generate pixel positions in the original image along the Line without using the FrontEnd

I think ImageTransformation doest just that. Using your definitions:

r = Min[id]/2;
dir = N@AngleVector[α];
(*modify step distance so we step at least 1 pixel in x or y \
direction*)
dir = dir/Max[Abs[dir]];
profile = 
  First@ImageData@
    ImageTransformation[img, 
     center + #[[1]] dir + {1, 0} &, {Round[r], 1}, DataRange -> Full,
      PlotRange -> {{0, r - 1}, {0, 1}}, Resampling -> "Nearest"];

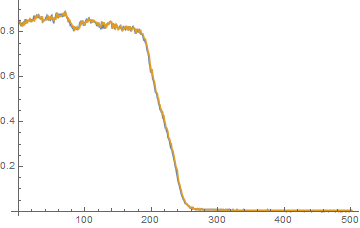
ListLinePlot[{profile, radialProfile}, PlotRange -> All]

enter image description here

There still is an unwanted interpolation, try simple check when α=0 and center = Round[Mean /@ pr];: radialProfile - PixelValue[img, Table[center + i {1, 0}, {i, 1, 502}]] returns only zeros while profile - PixelValue[img, Table[center + i {1, 0}, {i, 1, 501}]] gives many zeros but also many interpolated values.

I agree this is weird. I'm guessing Resampling->"Nearest" interpolates if a coordinate is exactly between two pixels? But I believe this is fixable by rounding coordinates and shifting them to pixel centers (Round[pt]-.5):

profile = 
  First@ImageData@
    ImageTransformation[img, 
     Round[center + #[[1]] dir] - .5 &, {Round[r], 1}, 
     DataRange -> Full, PlotRange -> {{0, r - 1}, {0, 1}}, 
     Resampling -> "Nearest"];

profile - PixelValue[img, Table[center + i {1, 0}, {i, 0, 500}]]
$\endgroup$
7
  • $\begingroup$ @AlexeyPopkov: You can turn off interpolation using Resampling->"Nearest". As for the profile length: I'm not sure what you want to do. In your code, the length of the profile seems to vary with the angle, unless the source image is quadratic. I've updated my answer $\endgroup$ Commented Oct 3, 2015 at 11:09
  • $\begingroup$ Please try ListLinePlot[{radialProfile, profile}]. It is clear that profile is deformed. $\endgroup$ Commented Oct 3, 2015 at 11:18
  • $\begingroup$ @AlexeyPopkov: You're right, I forgot that ImageTransformation's PlotRange->Full option strangely uses source image dimensions. $\endgroup$ Commented Oct 3, 2015 at 11:38
  • $\begingroup$ There still is an unwanted interpolation, try simple check when α=0 and center = Round[Mean /@ pr];: radialProfile - PixelValue[img, Table[center + i {1, 0}, {i, 1, 502}]] returns only zeros while profile - PixelValue[img, Table[center + i {1, 0}, {i, 1, 501}]] gives many zeros but also many interpolated values. $\endgroup$ Commented Oct 3, 2015 at 12:05
  • $\begingroup$ @AlexeyPopkov: I don't think this is a result of interpolation. I tried ImageTransformation on an image containing random integer values, and the result contained only integers, too. If it used interpolation, I'd have seen some rational numbers. My guess is it's just rounding differently than PixelValue $\endgroup$ Commented Oct 3, 2015 at 12:32
2
$\begingroup$

As mentioned in the comments, there is an implementation of Bresenham's line algorithm by halirutan:

bresenham[p0_, p1_] := Module[{dx, dy, sx, sy, err, newp},
  {dx, dy} = Abs[p1 - p0];
  {sx, sy} = Sign[p1 - p0];
  err = dx - dy;
  newp[{x_, y_}] := 
   With[{e2 = 2 err}, {If[e2 > -dy, err -= dy; x + sx, x], 
     If[e2 < dx, err += dx; y + sy, y]}];
  NestWhileList[newp, p0, # =!= p1 &, 1]
]

One significant limitation of this algorithm is that it requires integer pixel positions for both the starting and the ending point of the line. It means that both ends of the line must be snapped to the pixel grid of the image (what isn't always desirable).

With this implementation my Rasterize code can be simplified to bresenham[centralPixelPosition, endingPixelPosition]:

α = Pi/10;
id = ImageDimensions[img];
(* center in the standard image coordinate system *)
center = id/2;
(* end of the radial line in the standard image coordinate system *)
endOfLine = 
  RegionIntersection[HalfLine[center, AngleVector[α]], 
    Line[{{1, 1}, {1, id[[2]]}, id, {id[[1]], 1}, {1, 1}} - 1/2]][[1]];
(* integer position of the central pixel for PixelValue *)
centralPixelPosition = Round@N[center + 1/2];
(* integer position of the ending pixel of the line for PixelValue *)
endingPixelPosition = Round@N[endOfLine + 1/2];
radialPixelPositionsBresenham = bresenham[centralPixelPosition, endingPixelPosition];
radialProfileBresenham = PixelValue[img, radialPixelPositionsBresenham];
Length@radialProfileBresenham 
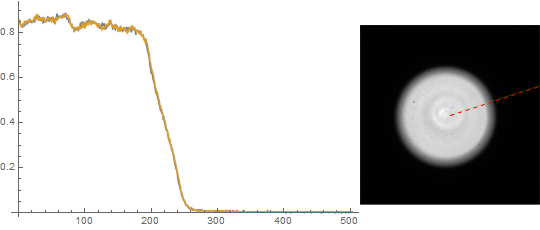
Row[{ListLinePlot[{radialProfile, radialProfileBresenham}, ImageSize -> Medium], 
  Show[ReplacePixelValue[img, radialPixelPositionsBresenham -> Green], 
   Epilog -> {Red, AbsoluteThickness[1], Dashed, HalfLine[center, AngleVector[α]]},
    ImageSize -> Small]}]
503

output

In the light of the bug in Rasterize this solution should be considered as more correct than the original one. But there is additional problem: the radial distances from the center according to Bresenham (as well as to the default behavior of Rasterize) aren't uniform:

Differences@
  Map[N@EuclideanDistance[centralPixelPosition, #] &, 
   radialPixelPositionsBresenham] // Short
{1., 1.23607, 0.92621, <<496>>, 0.95178, 1.25877, 0.951583}

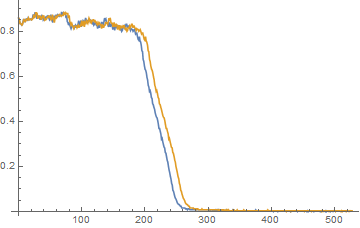
So when computing correct radial profile one should take the distances into the consideration:

ListLinePlot[{Transpose[{Range[0, Length[radialProfileBresenham] - 1], 
    radialProfileBresenham}], 
  Transpose[{Map[N@EuclideanDistance[centralPixelPosition, #] &, 
     radialPixelPositionsBresenham], radialProfileBresenham}]}]

plot

Indeed the distortion due to non-uniform placement of pixels on the radial line is very significant.

$\endgroup$

Not the answer you're looking for? Browse other questions tagged or ask your own question.