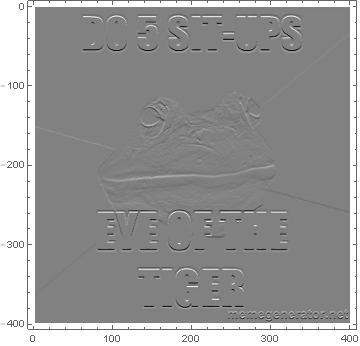
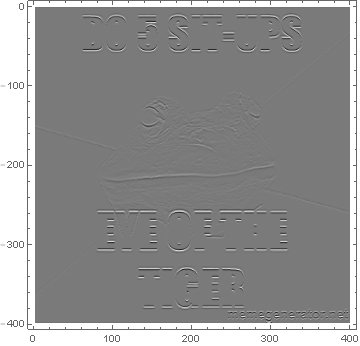
Using ND is not necessary, as Mathematica makes it easy to construct InterpolatingFunction objects, which can then be formally differentiated using Derivative. First, a sample image:
data = Import[
  "http://41.media.tumblr.com/bece7ed81870c8e9b904290700451eb2/tumblr_\
mv8m2sE2FW1slvzano1_400.jpg"]

Convert to grayscale, and then convert the resulting matrix into an InterpolatingFunction object:
imData = ImageData[ColorConvert[data, "Grayscale"]];
f = ListInterpolation[imData];
Plot the InterpolatingFunction using DensityPlot:
DensityPlot[f[-x, y], {y, 1, 400}, {x, -1, -398}, PlotPoints -> 300,
 ColorFunction -> GrayLevel]

Plot the first partial derivative in the $x$-direction:
g = Derivative[1, 0][f];
DensityPlot[g[-x, y], {y, 1, 400}, {x, -1, -398}, PlotPoints -> 300,
 PlotRange -> All, ColorFunction -> GrayLevel]

Plot the second partial derivative in the $x$-direction:
h = Derivative[2, 0][f];
DensityPlot[h[-x, y], {y, 1, 400}, {x, -1, -398}, PlotPoints -> 300,
 PlotRange -> All, ColorFunction -> GrayLevel]

Of course, you can get better results with even less work by using bill s's answer.


ImageData[sample][[x,y]]should give you the value you are looking for. Take a look atInterpolationfor the 2nd part of your question. $\endgroup$