After the August 2010 discovery that the diameter of the Rubik graph is 20, I wanted to make a way to visualize Rubik's graph. Since there are about $4.3 \times 10^{19}$ vertices in this graph, it is not feasible to store the whole thing. However, it is a Cayley graph of a group with 6 generators, it is 6-regular, and given any vertex $v$ in the graph, it's neighborhood $N(v)$ can be generated.
Using Roman Maeder's Wolfram Demonstrations Project as a basis, I tried to make a way to visualize this graph, one neighborhood at a time.
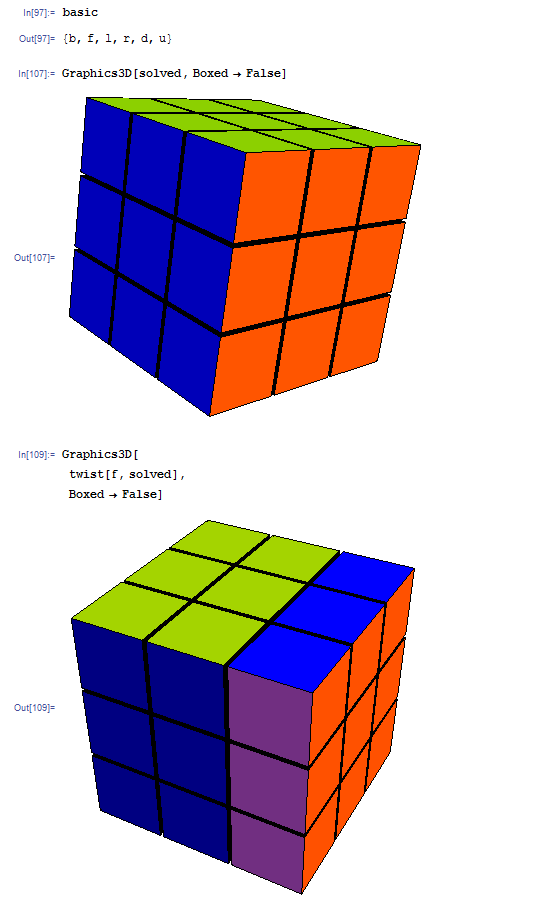
Starting with the GraphicsComplex solved, and the operation twist, which is simple enough to operate:

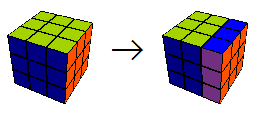
I want to construct a graph that displays the neighborhood, namely, those configurations of the Rubik's cube that can be reached by a R,L,F,B,U or D operation. The edge corresponding to the operation above should look like this:

I would like to do three things:
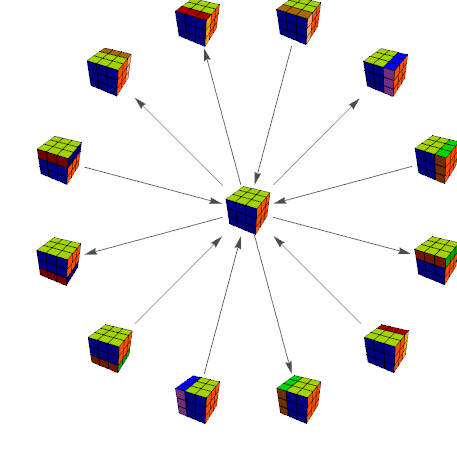
- Given a configuration $v$, I would like to display $N(v)$, with the edges looking like the graphic above
- Make it interactive, so that when I click on one of the configurations, it's neighborhood is output
- Display the cubes as 3D objects, so that they can be rotated
The 3D part would be nice, but it's not necessary. How would I go about doing this?

