4
$\begingroup$

Is there a way to make the following graph with two dimples? Like the central indent and another indent to the side to simulate a central mass like the sun and another smaller mass like the Earth in the same plot.

Code:

RevolutionPlot3D[-1/z, {z, 0, 4}, Boxed -> False, Axes -> False, 
 Ticks -> None, PlotStyle -> Opacity[.1], ImageSize -> {300, 350}]
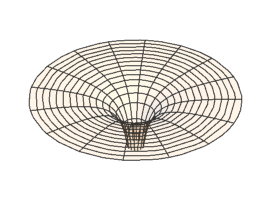
enter image description here

Note that this code came from Wolfram Demonstrations of an embedded Schwarzschild diagram. Any suggestions would be greatly appreciated.

Stephen

$\endgroup$

2 Answers 2

5
$\begingroup$

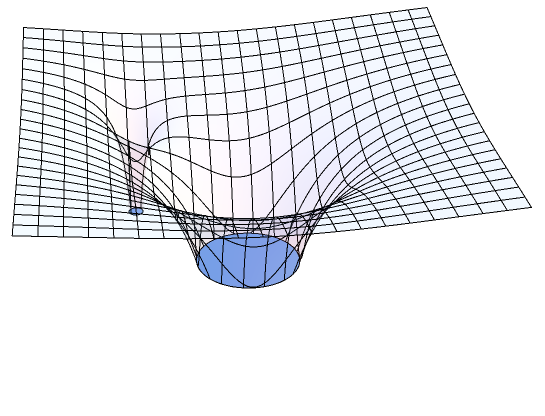
You just need to insert the correct potential, (and change plot function since we lose azimuthal symmetry). For example, we can create a smaller dimple at the position (2,2)

Plot3D[-1/Sqrt[(x^2 + y^2)] - .1/Sqrt[((x - 2)^2 + (y - 2)^2)], {x, -4, 4}, {y, -4, 4}, 
       Boxed -> False, Axes -> False, Ticks -> None,
       PlotStyle -> Opacity[.1], ImageSize -> {300, 350}, Mesh -> 20]

enter image description here

EDIT

In this answer I used the potential $1/r$ that appears in the question. Of course this potential is singular in the origin and can't be used for objects with a finite mass such as the Earth or the Sun. It is however easy to replace the potential above with a more realistic one. Moreover, a $1/r$ is a good approximation at distances larger than the radius of the object.

$\endgroup$
2
  • $\begingroup$ Good idea but your function is singular at the two centers of the holes. The user wants to plot the curvature due to the mass of the Sun and that of the Earth, but surely these two stellar objects do not act like black holes thus creating infinite deep holes! $\endgroup$
    – Vaggelis_Z
    Commented Jan 6, 2015 at 13:28
  • 1
    $\begingroup$ @Vaggelis_Z very true indeed. I simply used the potential in the question (which is singular). Of course the OP can use the potential that best suits his/her needs! $\endgroup$ Commented Jan 6, 2015 at 18:19
2
$\begingroup$
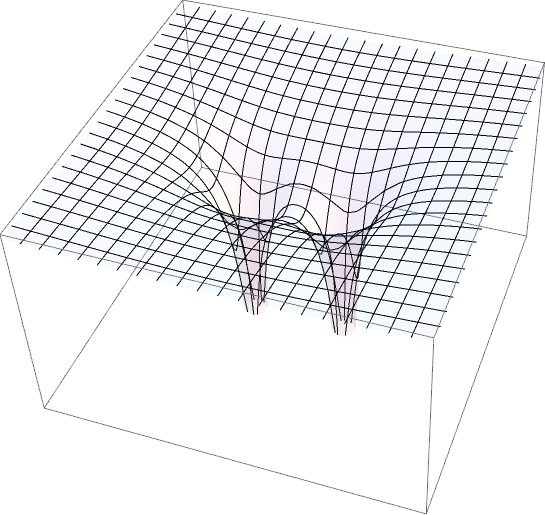
ParametricPlot3D[ {x, y, -1/Norm[{x + 1, y}] - 1/Norm[{x - 1, y}]},
                  {x, -4, 4}, {y, -4, 4},
                  PlotRange -> {{-4, 4}, {-4, 4}, {-5, Automatic}}, Mesh -> 20,
                  Axes -> False, Ticks -> None, PlotStyle -> Opacity[.1]]

enter image description here

$\endgroup$

Your Answer

By clicking “Post Your Answer”, you agree to our terms of service and acknowledge you have read our privacy policy.

Not the answer you're looking for? Browse other questions tagged or ask your own question.