I wonder about how I could make a Graph scale automatically when I vary the size of the vertices.
I would like to visualize information with a Graph. The vertices all have e.g. additional info like a weight which I would like to visualize with the vertices drawn with different sizes.
However, when I define the sizes, the graph keeps the original (as opposed to the new) layout. The graph then becomes invisible.
Graph[{1 \[UndirectedEdge] 2, 2 \[UndirectedEdge] 3,3 \[UndirectedEdge] 1, 3 \[UndirectedEdge] 4}]
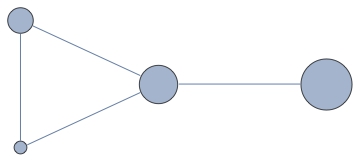
shows:

Now I add the "weight"
Graph[{1 \[UndirectedEdge] 2, 2 \[UndirectedEdge] 3,3 \[UndirectedEdge] 1, 3 \[UndirectedEdge] 4},VertexSize -> {1 -> 1.1, 2 -> 1.2, 3 -> 1.3, 4 -> 1.4}]
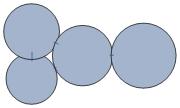
This shows:

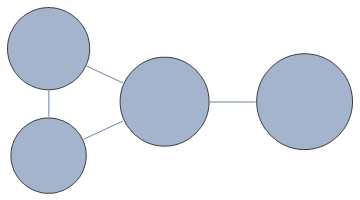
What I would like is that the Graph would be like

Any thoughts?
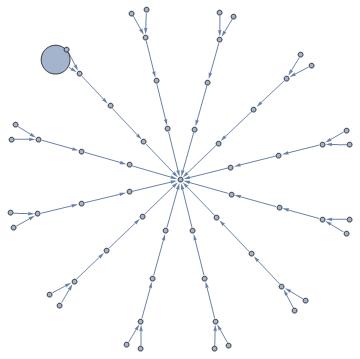
This is a graph currently working on. As you can see one vertex hits his neighbour. I would expect MM to or reposition this vertex a bit further or to scale down all nodes. Of course this can be done by dividing the vertexes by a number. But this is manual work to see what looks best. I hope there is another way.


Graph[{1 \[UndirectedEdge] 2, 2 \[UndirectedEdge] 3, 3 \[UndirectedEdge] 1, 3 \[UndirectedEdge] 4}, VertexSize -> {1 -> {"Scaled", 1.1/15}, 2 -> {"Scaled", 1.2/15}, 3 -> {"Scaled", 1.3/15}, 4 -> {"Scaled", 1.4/15}}]? $\endgroup$