4
$\begingroup$

I have made an animated graph that shows the changes of certain functions in time with different vertex sizes and colors:

gr = TreeGraph[RandomInteger[#] <-> # + 1 & /@ Range[0, 30], 
   VertexSize -> 0];

Manipulate[
 Show[{SetProperty[
    gr, {VertexSize -> 
      Table[ii -> 0.4 Sin[ii tstep]^2, {ii, VertexList[gr]}], 
     VertexStyle -> 
      Table[ii -> ColorData["Rainbow"][Cos[ii tstep]^2], {ii, 
        VertexList[gr]}]}], 
   Graphics[
    Text[Style[StringJoin["T=" , ToString[tstep]], Bold, 20], 
     Scaled[{0, 1}]], ImageSize -> {250, 100}]}], {tstep, 0, 5, 0.1}]

A sample result looks like this:

enter image description here

How can I add a legend to show the scale of vertex sizes and colors? The closest solution I found was this one but I don't know how to implement the scaling part for what's shown in the legend to follow the style of the graph nodes.

$\endgroup$

3 Answers 3

2
$\begingroup$

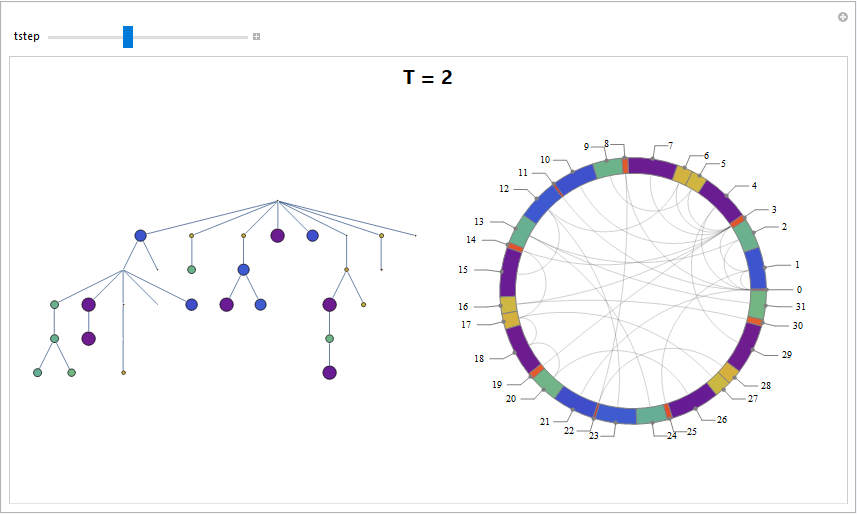
You can also use GraphComputation`GraphPropertyChart as a legend.

Using @halmir's scaling parameters:

gr = TreeGraph[RandomInteger[#] <-> (# + 1) & /@ Range[0, 30], 
  VertexSize -> 0, PerformanceGoal -> "Speed"];

Manipulate[vsize = Table[ii -> 0.4 Sin[ii tstep]^2, {ii, VertexList[gr]}];
 vstyle = Table[ii -> ColorData["Rainbow"][Cos[ii tstep]^2], {ii, VertexList[gr]}];
 vsizescaled = Rescale[vsize[[All, 2]], Through[{Min, Max}[vsize[[All, 2]]]], {.5, 12}];
 Labeled[Legended[Show @ SetProperty[gr, {VertexSize -> vsize, VertexStyle -> vstyle, 
     ImageSize -> 400}], 
   GraphComputation`GraphPropertyChart[gr, Automatic -> vsizescaled, 
    ChartStyle -> vstyle[[All, 2]], ImageSize -> 400]], 
  Style[StringJoin["T = ", ToString[tstep]], Bold, 20, "Panel"], Top], 
{{tstep, 2}, 0, 5, 0.1}

enter image description here

Using a BarChart as the legend

BarChart[vsizescaled, ChartStyle -> vstyle[[All, 2]], BarSpacing -> 0,
  AspectRatio -> 4, BarOrigin -> Left, Axes -> False, PerformanceGoal -> "Speed",
 ChartLabels -> Placed[VertexList[gr], Before], ImageSize -> 100]

we get

enter image description here

You can also use slightly modified version of the legend in @halmir's answer as ChartLegends in GraphComputation`GraphPropertyChart

ChartLegends -> PointLegend[Directive @@@ Transpose[{vstyle[[All, 2]], 
 AbsolutePointSize /@ vsizescaled}],  VertexList[gr], 
 LegendMarkerSize -> 20, LegendLayout -> {"Column", 4}]

to get

enter image description here

$\endgroup$
3
  • $\begingroup$ this is so cool, +1. $\endgroup$
    – Alucard
    Commented Dec 25, 2017 at 4:14
  • $\begingroup$ Amazing! Didn't even think of having a BarChart as the legend. $\endgroup$
    – MathX
    Commented Dec 28, 2017 at 20:20
  • $\begingroup$ @MathX, thank you for the accept. $\endgroup$
    – kglr
    Commented Dec 29, 2017 at 4:41
3
$\begingroup$

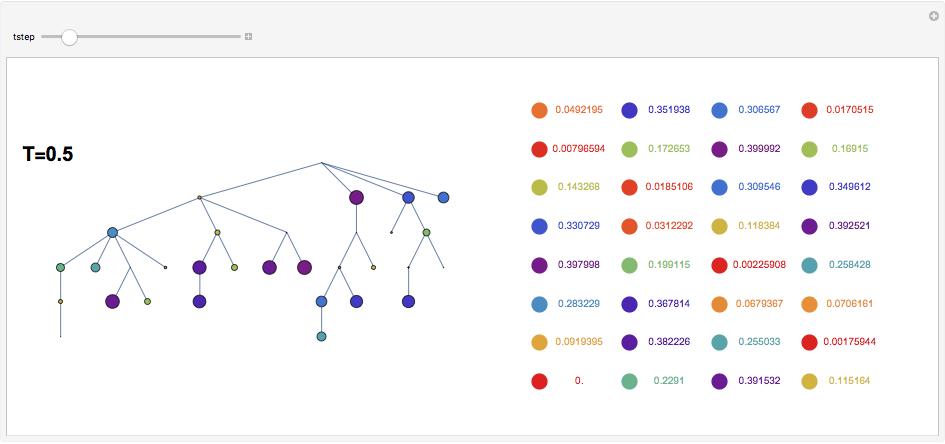
I think, this could be a starting point:

gr = TreeGraph[RandomInteger[#] <-> # + 1 & /@ Range[0, 30], 
VertexSize -> 0];

 Manipulate[
 GraphicsRow[{Show[{SetProperty[
  gr, {VertexSize -> 
    Table[ii -> 0.4 Sin[ii tstep]^2, {ii, VertexList[gr]}], 
   VertexStyle -> 
    Table[ii -> ColorData["Rainbow"][Cos[ii tstep]^2], {ii, 
      VertexList[gr]}]}], 
   Graphics[
  Text[Style[StringJoin["T=", ToString[tstep]], Bold, 20], 
   Scaled[{0, 1}]]]}], 
  Graphics[{PointSize[0.05], #[[2]], Point[#[[3]]], 
   Text[ToString[#[[1]]], #[[4]]]} & /@ 
 Transpose@{Table[0.4 Sin[ii tstep]^2, {ii, VertexList[gr]}], 
   Table[ColorData["Rainbow"][Cos[ii tstep]^2], {ii, 
     VertexList[gr]}], 
   Tuples[{Rescale[Range[4]], Rescale[Range[8]]}], 
   Tuples[{Rescale[Range[4], {1, 4}, {0.15, 1.15}], 
     Rescale[Range[8]]}]}]
 }, ImageSize -> {900, 350}
], 
{tstep, 0, 5, 0.1}
]

enter image description here

$\endgroup$
2
  • $\begingroup$ I like it. Thanks. It gave me some ideas but let's see if others can come up with any alternatives. I was thinking of having the range of sizes and range of colors depicted in several classes. These are scaled based on the total range of the changes and won't change from frame to frame. $\endgroup$
    – MathX
    Commented Nov 30, 2017 at 21:30
  • $\begingroup$ You are welcome. Yes, let see what others add or propose. Indeed, there are masters around here, :)) $\endgroup$ Commented Nov 30, 2017 at 21:36
2
$\begingroup$

Using PointLegend:

Manipulate[
 vsize = Table[ii -> 0.4 Sin[ii tstep]^2, {ii, VertexList[gr]}];
 vstyle = 
  Table[ii -> ColorData["Rainbow"][Cos[ii tstep]^2], {ii, 
    VertexList[gr]}]; 
 Legended[Show[{SetProperty[
     gr, {VertexSize -> vsize, VertexStyle -> vstyle}], 
    Graphics[
     Text[Style[StringJoin["T=", ToString[tstep]], Bold, 20], 
      Scaled[{0, 1}]]]}],
  PointLegend[
   Directive @@@ 
    Transpose[{vstyle[[All, 2]], 
      AbsolutePointSize /@ 
       Rescale[vsize[[All, 2]], MinMax[vsize[[All, 2]]], {.5, 12}]}], 
   VertexList[gr], LegendFunction -> "Panel"]], {tstep, 0, 5, 0.1}]
$\endgroup$
1
  • $\begingroup$ This is great. Thanks! I think I can work on this to get the static legend that I want. $\endgroup$
    – MathX
    Commented Dec 1, 2017 at 18:56

Your Answer

By clicking “Post Your Answer”, you agree to our terms of service and acknowledge you have read our privacy policy.

Not the answer you're looking for? Browse other questions tagged or ask your own question.