Problem: I have a plot with legend stored in a variable.
datatry=Table[{RandomReal[{0, 10}], RandomReal[{0, 10}]}, {i, 10}, {j, 3}];
plot = ListPlot[datatry, PlotLegends -> LineLegend[Table[i, {i, 5}]]]
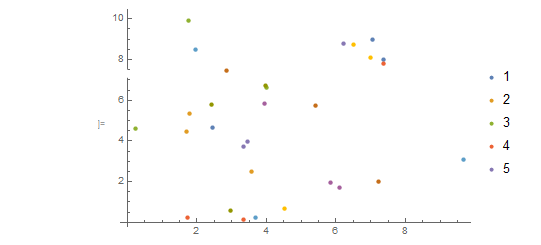
This plot already has a legend as you can see below:

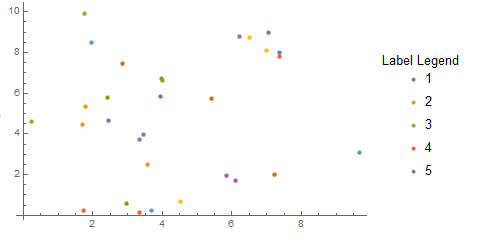
Now I want to change the variable 'plot' such that a label is added to the legend. I found a way to do this by replacing the entire linelegend part with a new linelegend and added plotlabel.
plot /. {LineLegend[
    List[Directive[PointSize[0.012833333333333334`],
      RGBColor[0.368417`, 0.506779`, 0.709798`],
      AbsoluteThickness[1.6`]],
     Directive[PointSize[0.012833333333333334`],
      RGBColor[0.880722`, 0.611041`, 0.142051`],
      AbsoluteThickness[1.6`]],
     Directive[PointSize[0.012833333333333334`],
      RGBColor[0.560181`, 0.691569`, 0.194885`],
      AbsoluteThickness[1.6`]],
     Directive[PointSize[0.012833333333333334`],
      RGBColor[0.922526`, 0.385626`, 0.209179`],
      AbsoluteThickness[1.6`]],
     Directive[PointSize[0.012833333333333334`],
      RGBColor[0.528488`, 0.470624`, 0.701351`],
      AbsoluteThickness[1.6`]],
     Directive[PointSize[0.012833333333333334`],
      RGBColor[0.772079`, 0.431554`, 0.102387`],
      AbsoluteThickness[1.6`]],
     Directive[PointSize[0.012833333333333334`],
      RGBColor[0.363898`, 0.618501`, 0.782349`],
      AbsoluteThickness[1.6`]],
     Directive[PointSize[0.012833333333333334`],
      RGBColor[1, 0.75`, 0], AbsoluteThickness[1.6`]],
     Directive[PointSize[0.012833333333333334`],
      RGBColor[0.647624`, 0.37816`, 0.614037`],
      AbsoluteThickness[1.6`]],
     Directive[PointSize[0.012833333333333334`],
      RGBColor[0.571589`, 0.586483`, 0.`], AbsoluteThickness[1.6`]]],
    List[1, 2, 3, 4, 5],
    Rule[LegendMarkers,
     List[List[False, Automatic], List[False, Automatic],
      List[False, Automatic], List[False, Automatic],
      List[False, Automatic], List[False, Automatic],
      List[False, Automatic], List[False, Automatic],
      List[False, Automatic], List[False, Automatic]]],
    Rule[Joined,
     List[False, False, False, False, False, False, False, False,
      False, False]], Rule[LabelStyle, List[]],
    Rule[LegendLayout, "Column"]] ->
   LineLegend[
    List[Directive[PointSize[0.012833333333333334`],
      RGBColor[0.368417`, 0.506779`, 0.709798`],
      AbsoluteThickness[1.6`]],
     Directive[PointSize[0.012833333333333334`],
      RGBColor[0.880722`, 0.611041`, 0.142051`],
      AbsoluteThickness[1.6`]],
     Directive[PointSize[0.012833333333333334`],
      RGBColor[0.560181`, 0.691569`, 0.194885`],
      AbsoluteThickness[1.6`]],
     Directive[PointSize[0.012833333333333334`],
      RGBColor[0.922526`, 0.385626`, 0.209179`],
      AbsoluteThickness[1.6`]],
     Directive[PointSize[0.012833333333333334`],
      RGBColor[0.528488`, 0.470624`, 0.701351`],
      AbsoluteThickness[1.6`]],
     Directive[PointSize[0.012833333333333334`],
      RGBColor[0.772079`, 0.431554`, 0.102387`],
      AbsoluteThickness[1.6`]],
     Directive[PointSize[0.012833333333333334`],
      RGBColor[0.363898`, 0.618501`, 0.782349`],
      AbsoluteThickness[1.6`]],
     Directive[PointSize[0.012833333333333334`],
      RGBColor[1, 0.75`, 0], AbsoluteThickness[1.6`]],
     Directive[PointSize[0.012833333333333334`],
      RGBColor[0.647624`, 0.37816`, 0.614037`],
      AbsoluteThickness[1.6`]],
     Directive[PointSize[0.012833333333333334`],
      RGBColor[0.571589`, 0.586483`, 0.`], AbsoluteThickness[1.6`]]],
    List[1, 2, 3, 4, 5],
    Rule[LegendMarkers,
     List[List[False, Automatic], List[False, Automatic],
      List[False, Automatic], List[False, Automatic],
      List[False, Automatic], List[False, Automatic],
      List[False, Automatic], List[False, Automatic],
      List[False, Automatic], List[False, Automatic]]],
    Rule[Joined,
     List[False, False, False, False, False, False, False, False,
      False, False]], Rule[LabelStyle, List[]],
    Rule[LegendLayout, "Column"], LegendLabel -> "Label Legend"]}
Is there a simpler, easier way to do this?


plot /. LineLegend[a__] :> LineLegend[a, LegendLabel -> "Label Legend"]? $\endgroup$