4
$\begingroup$

Is there a way to add ContourLabels on ContourPlot3D ? (tried in Mathematica 9)

I tried doing the following code :

f[x1_, x2_, x3_] := x1 + x2^2 + x2 x3 + 2 x3^2
h[x1_, x2_, x3_] := x1^2 + x2^2 + x3^2 - 1
a = 1;
ContourPlot3D[
 h[x1, x2, x3] == 0,
 {x1, -a, a}, {x2, -a, a}, {x3, -a, a},
 MeshFunctions -> {f[#1, #2, #3] &},
 PlotPoints -> 20,
 ContourLabels -> Automatic
 ]

It throws the following error :

ContourPlot3D::optx: "Unknown option ContourLabels->Automatic in ContourPlot3D[h[x1,x2,x3]==0,{x1,-a,a},{x2,-a,a},{x3,-a,a},MeshFunctions->{f[#1,#2,#3]&},PlotPoints->20,ContourLabels->Automatic]"

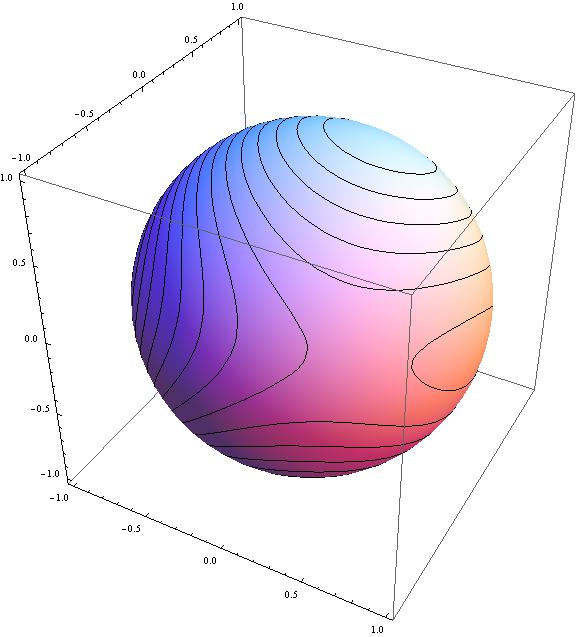
If I removed ContourLabels -> Automatic, it works fine and I get the following output

ContourPlot's output when ContourLabels option is removed

Edit 1: I would like to add the contours for the mesh (black) lines as shown in the figure

$\endgroup$
3
  • $\begingroup$ @Artes : Thanks for pointing it out - the solution was to overlay the different plots. Whereas in this case of plotting contourLabels, one cannot user overlay (at least directly), since the position of the contourlines are not known apriori. Maybe one can get the contours from the expression (mathematica.stackexchange.com/questions/20281/…) and then evaluate the value of the function there and put a value there. But I was interested in knowing if there is a way to get it done using contourLabels $\endgroup$ Commented Feb 4, 2014 at 14:17
  • $\begingroup$ Do you need labels for the contour surface (in this case a single sphere) or for the mesh lines (the black lines)? I believe that automatic labelling is not supported for either in 3D, so this would require some (possibly nontrivial) work to implement. I might be wrong though. Personally I would be tempted to add the labels to the figure by hand. $\endgroup$
    – Szabolcs
    Commented Feb 4, 2014 at 16:46
  • $\begingroup$ I would like to add the contours for the mesh (black) lines here $\endgroup$ Commented Feb 4, 2014 at 17:49

1 Answer 1

3
$\begingroup$

You might be able to create something suitable from the coordinates of the Line primitives making up the mesh lines. Perhaps the simplest thing would be add a tooltip to each line, which you can do with:

f[x1_, x2_, x3_] := x1 + x2^2 + x2 x3 + 2 x3^2
h[x1_, x2_, x3_] := x1^2 + x2^2 + x3^2 - 1
a = 1;
cp = ContourPlot3D[h[x1, x2, x3] == 0, {x1, -a, a}, {x2, -a, a}, {x3, -a, a}, 
   MeshFunctions -> {f[#1, #2, #3] &}, PlotPoints -> 20];

Normal[cp] /. l_Line :> Tooltip[l, f @@ Mean @@ l]
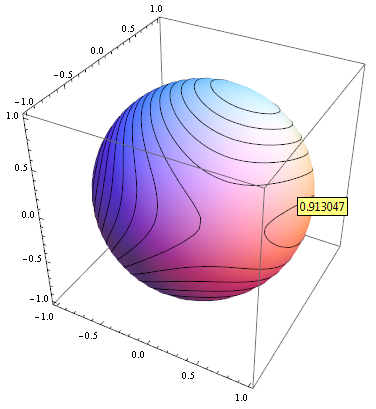
enter image description here

To actually put labels into the graphic is not so simple. You could add labels using Text but these will be drawn on top of the graphics (so labels at the back of the sphere will show through, making it hard to tell which labels belong to which lines). There is also the question of where along the mesh line to put its label, ideally they should be nicely spaced out.

Here is a first go at a method for labelling the mesh lines using textured polygons. The label is placed at a random point somewhere on each mesh line, and rotated so that the label is tangential to the surface. It would need a lot more work to be of general use.

normal[x1_, x2_, x3_] = Grad[h[x1, x2, x3], {x1, x2, x3}];

labeldata = Cases[Normal@cp, Line[data_] :> 
 ({#, normal @@ #, f @@ Mean[data]} &[RandomChoice[data]]), -1]

label[{pt_, n_, val_}] := Module[{l, x, y},
  l = Rasterize[Round[val, 0.01]];
  {x, y} = ImageDimensions[l];
  {Texture[l], Translate[Rotate[Polygon[
      0.004 {{-x, -y, 0}, {-x, y, 0}, {x, y, 0}, {x, -y, 0}}, 
      VertexTextureCoordinates -> {{0, 0}, {0, 1}, {1, 1}, {1, 0}}], 
  {{0, 0, 1}, n}], pt + 0.01 n]}]

Show[cp, Graphics3D[{Glow[White], label /@ labeldata}]]
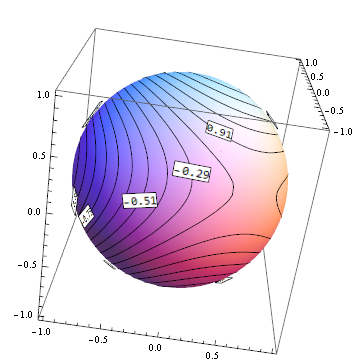
enter image description here

$\endgroup$
0

Your Answer

By clicking “Post Your Answer”, you agree to our terms of service and acknowledge you have read our privacy policy.

Not the answer you're looking for? Browse other questions tagged or ask your own question.