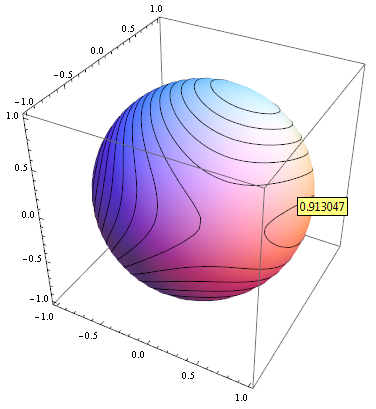
You might be able to create something suitable from the coordinates of the Line primitives making up the mesh lines. Perhaps the simplest thing would be add a tooltip to each line, which you can do with:
f[x1_, x2_, x3_] := x1 + x2^2 + x2 x3 + 2 x3^2
h[x1_, x2_, x3_] := x1^2 + x2^2 + x3^2 - 1
a = 1;
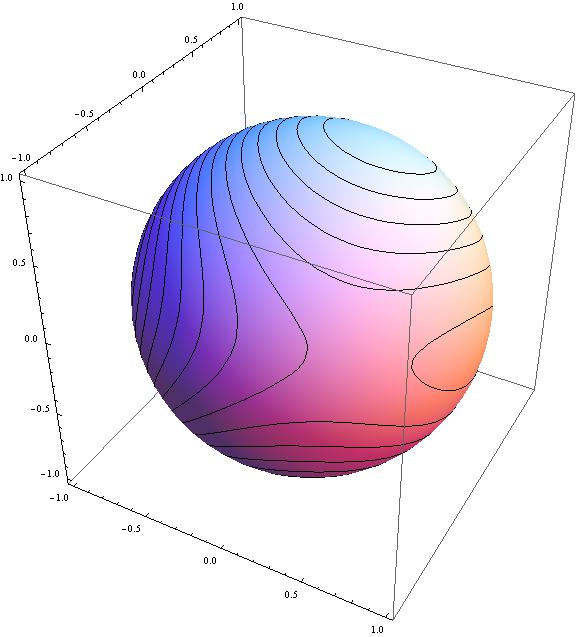
cp = ContourPlot3D[h[x1, x2, x3] == 0, {x1, -a, a}, {x2, -a, a}, {x3, -a, a},
   MeshFunctions -> {f[#1, #2, #3] &}, PlotPoints -> 20];

Normal[cp] /. l_Line :> Tooltip[l, f @@ Mean @@ l]

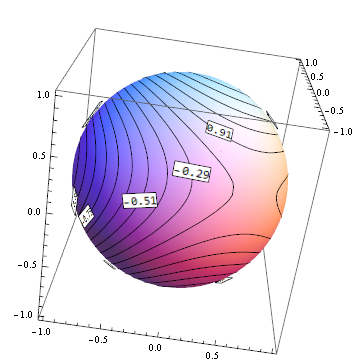
To actually put labels into the graphic is not so simple. You could add labels using Text but these will be drawn on top of the graphics (so labels at the back of the sphere will show through, making it hard to tell which labels belong to which lines). There is also the question of where along the mesh line to put its label, ideally they should be nicely spaced out.
Here is a first go at a method for labelling the mesh lines using textured polygons. The label is placed at a random point somewhere on each mesh line, and rotated so that the label is tangential to the surface. It would need a lot more work to be of general use.
normal[x1_, x2_, x3_] = Grad[h[x1, x2, x3], {x1, x2, x3}];

labeldata = Cases[Normal@cp, Line[data_] :>
 ({#, normal @@ #, f @@ Mean[data]} &[RandomChoice[data]]), -1]

label[{pt_, n_, val_}] := Module[{l, x, y},
  l = Rasterize[Round[val, 0.01]];
  {x, y} = ImageDimensions[l];
  {Texture[l], Translate[Rotate[Polygon[
      0.004 {{-x, -y, 0}, {-x, y, 0}, {x, y, 0}, {x, -y, 0}},
      VertexTextureCoordinates -> {{0, 0}, {0, 1}, {1, 1}, {1, 0}}],
  {{0, 0, 1}, n}], pt + 0.01 n]}]

Show[cp, Graphics3D[{Glow[White], label /@ labeldata}]]


