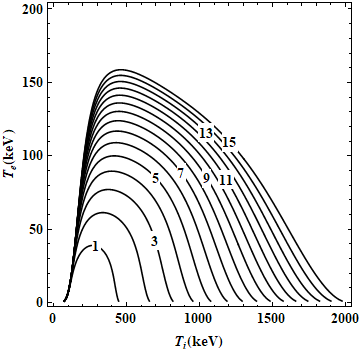
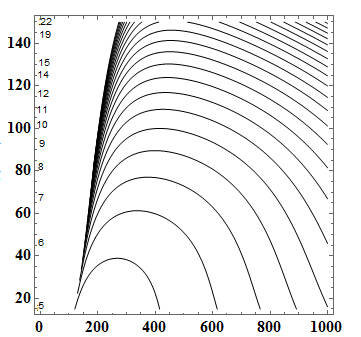
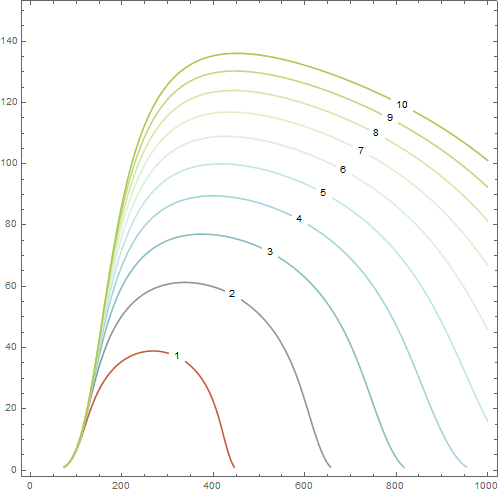
Manual approach: make small variation of angle from main diagonal so that labels do not overlap; all numbers (300, 500, ...) are approximately taken from the figure.
SeedRandom[1234]; ang = 0.1 + RandomSample[Range[-0.04, 0.03, 0.01]];

ti = Ti /.
FindRoot[(eq[#1] /. Te -> #2 Ti) ==
  0, {Ti, #3}] & @@@ (Transpose[{Range[1, 15, 2],
 ang, {300, 500, 700, 800, 900, 1000, 1100, 1200}}])//Quiet

    ContourPlot[Evaluate@eq[Range[15]], {Ti, 1, 2000}, {Te, 1, 200},
 ContourStyle -> Black,
 FrameStyle -> Directive[Black, Bold, 14, FontFamily -> "Times"],
 FrameLabel -> {"\!\(\*SubscriptBox[\(T\), \(i\)]\)(keV)",
   "\!\(\*SubscriptBox[\(T\), \(e\)]\)(keV)"}, PlotPoints -> 50,
 LabelStyle -> Directive[Black, Bold, FontFamily -> "Times", 14],
 Epilog -> (Text[
      Style[Framed[#1, Background -> White, FrameStyle -> None,
        FrameMargins -> 0], 14, FontFamily -> "Times", Bold], #2] & @@@
     Transpose[{Range[1, 15, 2], Transpose[{ti, ang ti}]}])]


Epilog -> Text[Framed["text",Background->White],{x, y}]). Coordinates can be computed withFindRootas intersection diagonal line with specific contour. $\endgroup$