3
$\begingroup$

I've found that the LevelSchemes package is extremely useful when combining several plots with precise control over where to place legends, making plots withing plots other neat stuff like that, however I ran into problems when I tried to combine a graphics object (like a .png file) and a plot.

Here is what I am trying to do:

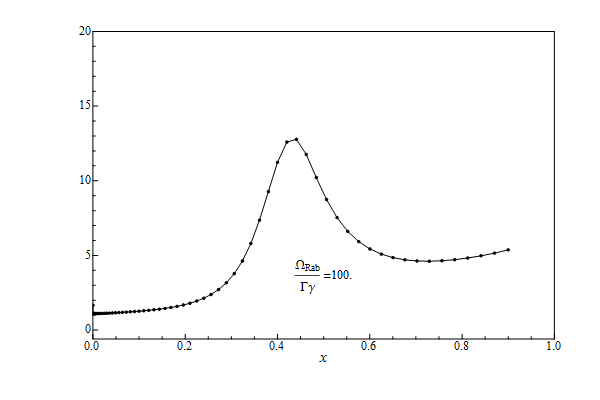
I have a plot depicting the squeezing parameter value in depending on the external electric field strength. Plot without the picture
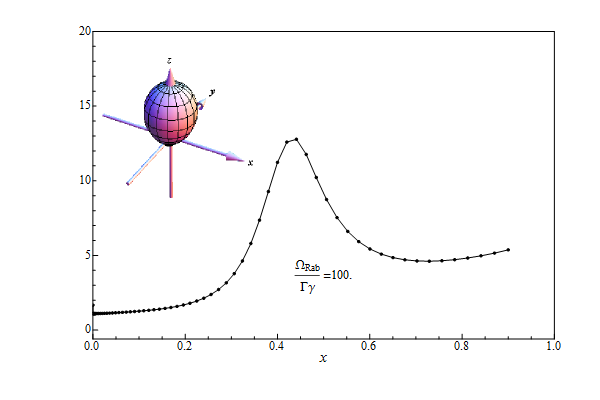
I wanted to obtain something that looks like this: This is what I want made by hand in a graphics editor (Inkscape)
To achieve said result I tried something like this:

Figure[
 {
  (*Main panel*)
  FigurePanel[
   {{0, 1}, {0, 1}}, PlotRange -> {{0, 1}, {-0.6, 20}}, 
   FrameTicks -> {Automatic, Automatic}, FontSize -> 15, 
   LabB -> textit["x"], BufferB -> 2.5, TickFontSize -> 12
   ],
  DataPlot[
   dati, Tag -> set[1]
   ],
  ScaledLabel[{0.5, 0.2}, 
   "some value=" <> 
    ToString[Some expression that returns a number], 
   FontSize -> 13],

 (*Smaller Pannel*)
  ScaledFigurePanel[
   {{0, 0.55}, {0.55, 0.95}},
   PlotRange -> {Automatic, Automatic}
   ],
   (*AMPSPlot is essentially SphericalPlot3D that takes a nxn matrix as an argument.
   It is found in the ADM package*)
  RawGraphics[
   Rasterize[
    Axes3D[AMPSPlot[
      WignerRotate[
       gdm[Flatten[sols[[30, 2]]]], {optlen[
         gdm[Flatten[sols[[30, 2]]]]], 0, 0}], PlotRange -> All, 
      Boxed -> False, Axes -> False]]]]

  },
 PlotRange -> {{-0.2, 1.1}, {-0.2, 1.1}}, ImageSize -> 100*{6, 4}

 ]

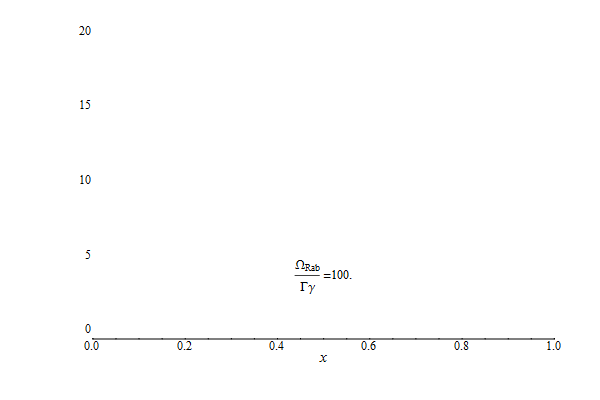
but I get something like this: "This doesn't work at all"
Is there any way to incoorporate pictures in graphics by LevelScheme? The main goal I am trying to do this is to see how the graphs look every time I tweak which set of parameters I've used, without going through the fiddly process of merging them in Inkscape.

$\endgroup$
5
  • 1
    $\begingroup$ Have you looked at Inset? It lets you specify where in a figure you want things (like your 3D graphic and your equation) to appear. $\endgroup$
    – bill s
    Commented Jan 16, 2014 at 15:39
  • $\begingroup$ I have only recently started working with 'LevelScheme' so I am not sure how to use Inset in that context and I would like to stick to the LevelScheme environment if possible. My problem with Inset is that it's coordinates are tied to those of the plot rather to the absolute coordinates of the frame (I think that's what's going on, I've had trouble positioning with Inset). $\endgroup$ Commented Jan 16, 2014 at 15:56
  • $\begingroup$ If you look under "Details and Options" for Inset there are many ways to specify the coordinates. $\endgroup$
    – bill s
    Commented Jan 16, 2014 at 16:03
  • $\begingroup$ You are, of course, right. For the time being I will probably try using standard Mathematica plotting tools and inset, but I am still curious whether it is possible to combine pictures and plots in LevelScheme as well. Thank you for the advice though! $\endgroup$ Commented Jan 16, 2014 at 16:07
  • $\begingroup$ Take a look at the SciDraw package which is the successor of LevelScheme. In the Examples-Tutorial.nb notebook that comes with the package you'll find an example precisely like what you are looking for. I was a latercomer to LevelScheme and I never properly learned it, so I can't help you with that package, but with SciDraw it's quite easy. $\endgroup$
    – Szabolcs
    Commented Jan 16, 2014 at 16:21

1 Answer 1

2
$\begingroup$

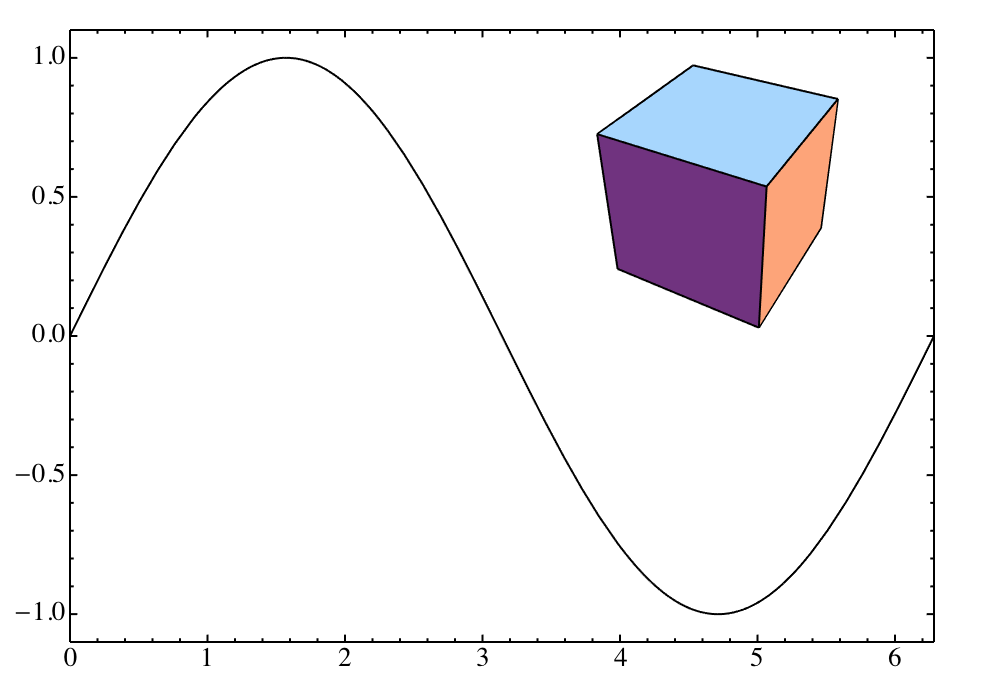
Here's an example of how to do it with the SciDraw package, which is the successor of LevelScheme (you'll be able to re-use some of what you've learned about LevelScheme). I'm not experienced with the original LevelScheme so I won't attempt to use it now or comment on its capabilities.

Needs["SciDraw`"]

Figure[
 FigurePanel[
  {
   FigLine@Plot[Sin[x], {x, 0, 2 Pi}];

   FigInset[Graphics3D[Cuboid[], Boxed -> False], 
       Scaled[{{0.5, 1}, {0.5, .95}}]];
  },
  XPlotRange -> {0, 2 Pi}, YPlotRange -> 1.1 {-1, 1}
 ]
]

The key was using FigInset. Just like with Inset, you can include practically anything that can appear in a notebook.

You'll find a similar but more detailed example of the same in the Examples-Tutorial.nb notebook that comes with the package.

$\endgroup$
1
  • $\begingroup$ Thank you, after trying SciDraw I have to admit that both the documentation is much more complete (the guide is excellent compared to the one for LevelScheme) and there are many more things you can do in it than in LevelScheme. $\endgroup$ Commented Jan 17, 2014 at 11:12

Your Answer

By clicking “Post Your Answer”, you agree to our terms of service and acknowledge you have read our privacy policy.

Not the answer you're looking for? Browse other questions tagged or ask your own question.