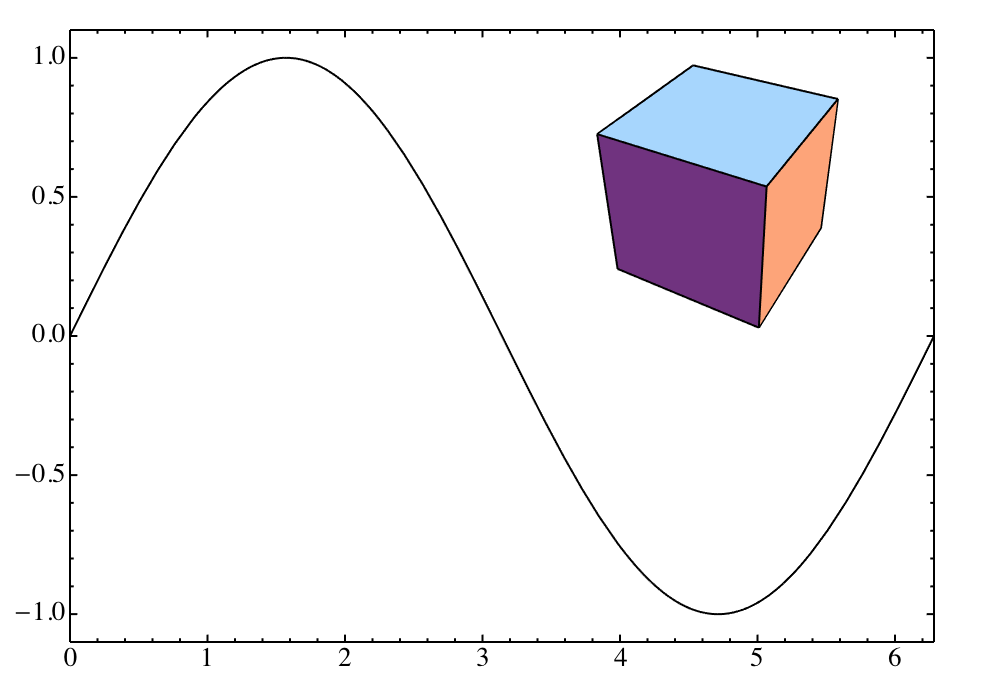
Here's an example of how to do it with the SciDraw package, which is the successor of LevelScheme (you'll be able to re-use some of what you've learned about LevelScheme). I'm not experienced with the original LevelScheme so I won't attempt to use it now or comment on its capabilities.
Needs["SciDraw`"]

Figure[
 FigurePanel[
  {
   FigLine@Plot[Sin[x], {x, 0, 2 Pi}];

   FigInset[Graphics3D[Cuboid[], Boxed -> False],
       Scaled[{{0.5, 1}, {0.5, .95}}]];
  },
  XPlotRange -> {0, 2 Pi}, YPlotRange -> 1.1 {-1, 1}
 ]
]

The key was using FigInset. Just like with Inset, you can include practically anything that can appear in a notebook.
You'll find a similar but more detailed example of the same in the Examples-Tutorial.nb notebook that comes with the package.
