I've been working on this research problem for months with some success by no global/proper solution to the problem.
So I have square, Hermitian matrices of various sizes ($8,20,38$ dimensions) with functional dependence on two variables, call them x and y. I am interested in plotting all the eigenvalues as functions of the $2$ variables x and y.
Let's call M the $8 \times 8$ hermitian matrix.
Plot3D[ Eigenvalues[M], {x,-1,1}, {y,-1,1}]
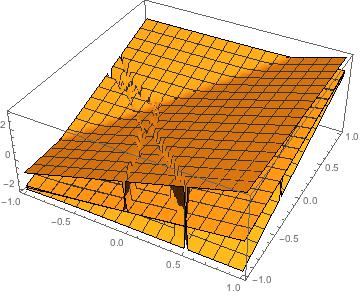
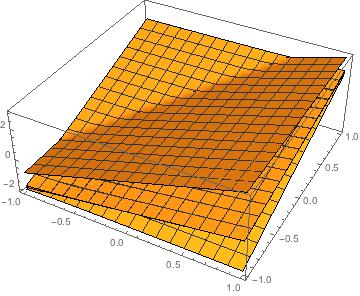
gives $8$ sheets corresponding to the eigenvalues of M as functions of x and y.
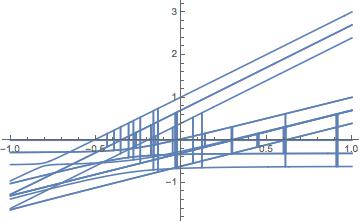
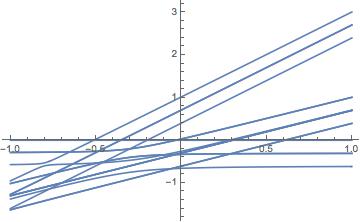
However, there will be many "jumps" between the sheets which totally obscure the plots. Basically, I think that during the plotting of the eigenvalues, for certain regions of the parameter space, Mathematica organizes the $8$ values differently, so the different sheets swap places, so we get tons of random garbage vertical bits between sheets.
I have spent months trying to resolve this in different ways, mostly involving methods to force Mathematica into a consistent sorting method. Here are some examples of failed methods:
Plot3D[ Sort[Eigenvalues[M]], {x,-1,1}, {y,-1,1}]

Plot3D[ Sort[Eigenvalues[M], Abs[#1] <= Abs[#2]&], {x,-1,1}, {y,-1,1}]

Block[{set=Ordering[ Eigenvalues[ M/.x->0 /. y->0], All, Abs[#1] <= Abs[#2]&]},
  Plot3D[ Eigenvalues[M][[set]], {x,-1,1}, {y,-1,1}]]

Block[{set=Ordering[ Ordering[Eigenvalues[ M/.x->0 /.y->0], All,
        Abs[#1] <= Abs[#2]&]]},
  Plot3D[ Eigenvalues[M][[set]], {x,-1,1}, {y,-1,1}]]

Block[{set = Ordering[Eigenvalues[ M /.x->0 /.y->0], All, Abs[#1] <= Abs[#2]&]},
  Plot3D[ Sort[ Eigenvalues[M][[set]]], {x,-1,1}, {y,-1,1}]]

Block[{set = Ordering[ Ordering[ Eigenvalues[ M /.x->0 /.y->0], All,
       Abs[#1] <= Abs[#2]&]]},
  Plot3D[ Sort[ Eigenvalues[M][[set]]], {x,-1,1}, {y,-1,1}]]
as well as other permutations of similar ideas and more. Some of these methods have worked somewhat, reducing the jumping or working in certain regimes of the parameter domain. But nothing works consistently.
Please help me understand the proper solution to this problem!

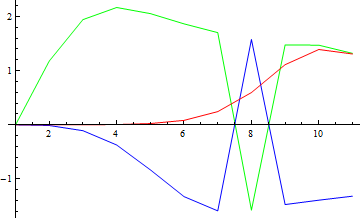
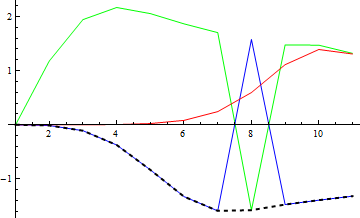
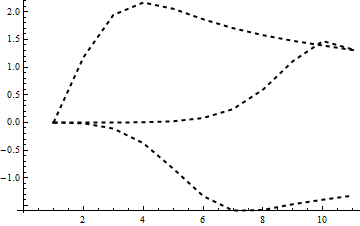
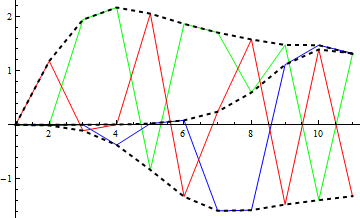
m = SparseArray[{i_, j_} -> Sin[i j x y], {3, 3}]; Plot3D[ Eigenvalues[m][[1]], {x, 0, 1}, {y, 0, 1}, PlotRange -> All]$\endgroup$