6
$\begingroup$

I use this code to solve a PDE:

a = 20;
F[x_, t_] = f[x, t] /. First@NDSolve[{D[f[x, t], x, x] == I D[f[x, t], t],
     f[-a, t] == 0,
     f[a, t] == 0,
     f[x, 0] == Sin[Pi/a (x - a)]}, 
    f[x, t], {x, -a, a}, {t, 0, 700}, MaxStepSize -> 0.005 a]

It gives the correct solution for all t until about 650. But if I take t higher, see what happens:

AbsoluteTiming[Table[F[x, 650], {x, -a, a}];]
AbsoluteTiming[Table[F[x, 695.1], {x, -a, a}];]

{0.000925, Null}

{2.382157, Null}

Threshold for t appears to be about $666.6$.

It appears to be orders of magnitude slower at evaluating the interpolating function. What's the reason for this?

EDIT:

Using NDSolve option InterpolationOrder -> All works around this.

$\endgroup$

1 Answer 1

5
$\begingroup$

I don't know why this is happening, but you can avoid it by recalculating the interpolation like this:

$HistoryLength = 0;
Needs["DifferentialEquations`InterpolatingFunctionAnatomy`"];
a = 20; 
mdfun = First[f /. NDSolve[{D[f[x, t], x, x] == I D[f[x, t], t], f[-a, t] == 0, 
                           f[a, t] == 0, f[x, 0] == Sin[Pi/a (x - a)]}, 
                           f, {x, -a, a}, {t, 0, 700}, MaxStepSize -> 0.005 a]]; 
s = Transpose[{Flatten[InterpolatingFunctionGrid[mdfun], 1], 
               Chop /@ Flatten[InterpolatingFunctionValuesOnGrid[mdfun], 1]}];

q = Interpolation[s];
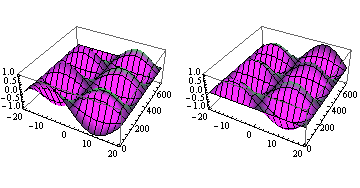
GraphicsRow@{Plot3D[Re@q[x, t], {x, -a, a}, {t, 0, 700}], 
             Plot3D[Im@q[x, t], {x, -a, a}, {t, 0, 700}]}

Mathematica graphics

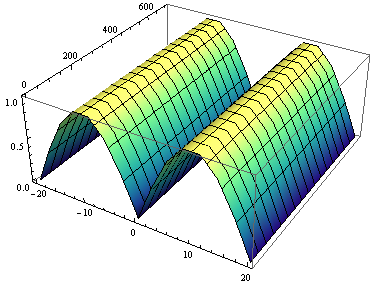
Plot3D[Abs@q[x, t], {x, -a, a}, {t, 0, 700}, ColorFunction -> "BlueGreenYellow"]

Mathematica graphics

$\endgroup$

Your Answer

By clicking “Post Your Answer”, you agree to our terms of service and acknowledge you have read our privacy policy.

Not the answer you're looking for? Browse other questions tagged or ask your own question.