When using the Finite Element Method of NDSolve to solve a set of ODE, the resulting InterpolatingFunction showcases a strange chattering in its derivatives. This behavior does not occur when using the default method or Runge-Kutta options.
Let me illustrate the issue with a very simple problem.
DEFAULT CASE
A reference solution can be obtained with the following code
w2 = 6;
m = 2;
T = 2.0;
sol = NDSolveValue[{q'[t] == ζ[t], ζ'[t] + w2*Sin[q[t]] == 0,
                    q[0] == Pi/3., ζ[0] == 0}, {q, ζ}, {t, 0, T}]
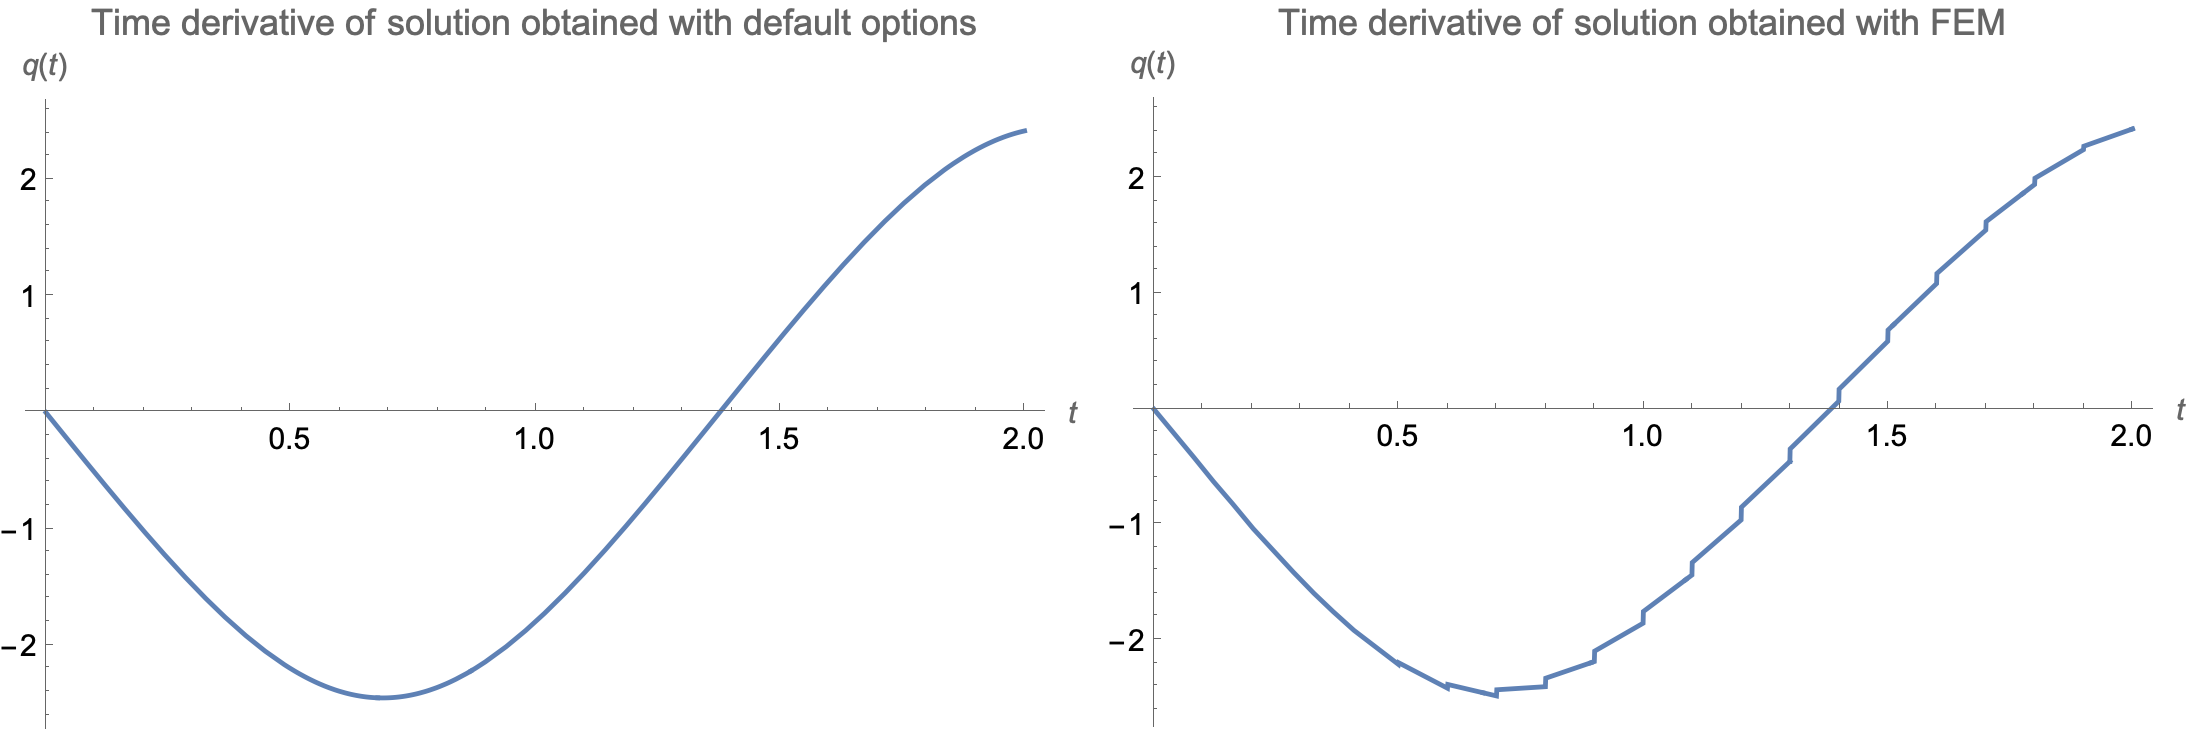
Solutions are smooth. One can easily plot the time derivative of the first solution with
Plot[sol[[1]]'[t], {t, 0, T}]
FEM CASE
The same solutions can be obtained by using the Finite Element Method option of NDSolve:
solFEM = NDSolveValue[{q'[t] == ζ[t], ζ'[t] + w2*Sin[q[t]] == 0,
                       DirichletCondition[{q[t] == Pi/3., ζ[t] == 0}, t == 0]},
                      {q, ζ}, t ∈ Line[{{0}, {T}}], Method -> {"FiniteElement"}]
Of course, the solutions are also smooth in this case and the time derivative of the first solution can be plotted with
Plot[solFEM[[1]]'[t], {t, 0, T}]
We can compare both plots and see that the one coming from the Finite Element Method has some chattering to it:
This is of course just one basic example and the issue shown here tends to be more troublesome for more complicated situations.
So, why does this happen? And since I really need the FEM option for a specific scenario, how can this be avoided or treated?
EDIT 1
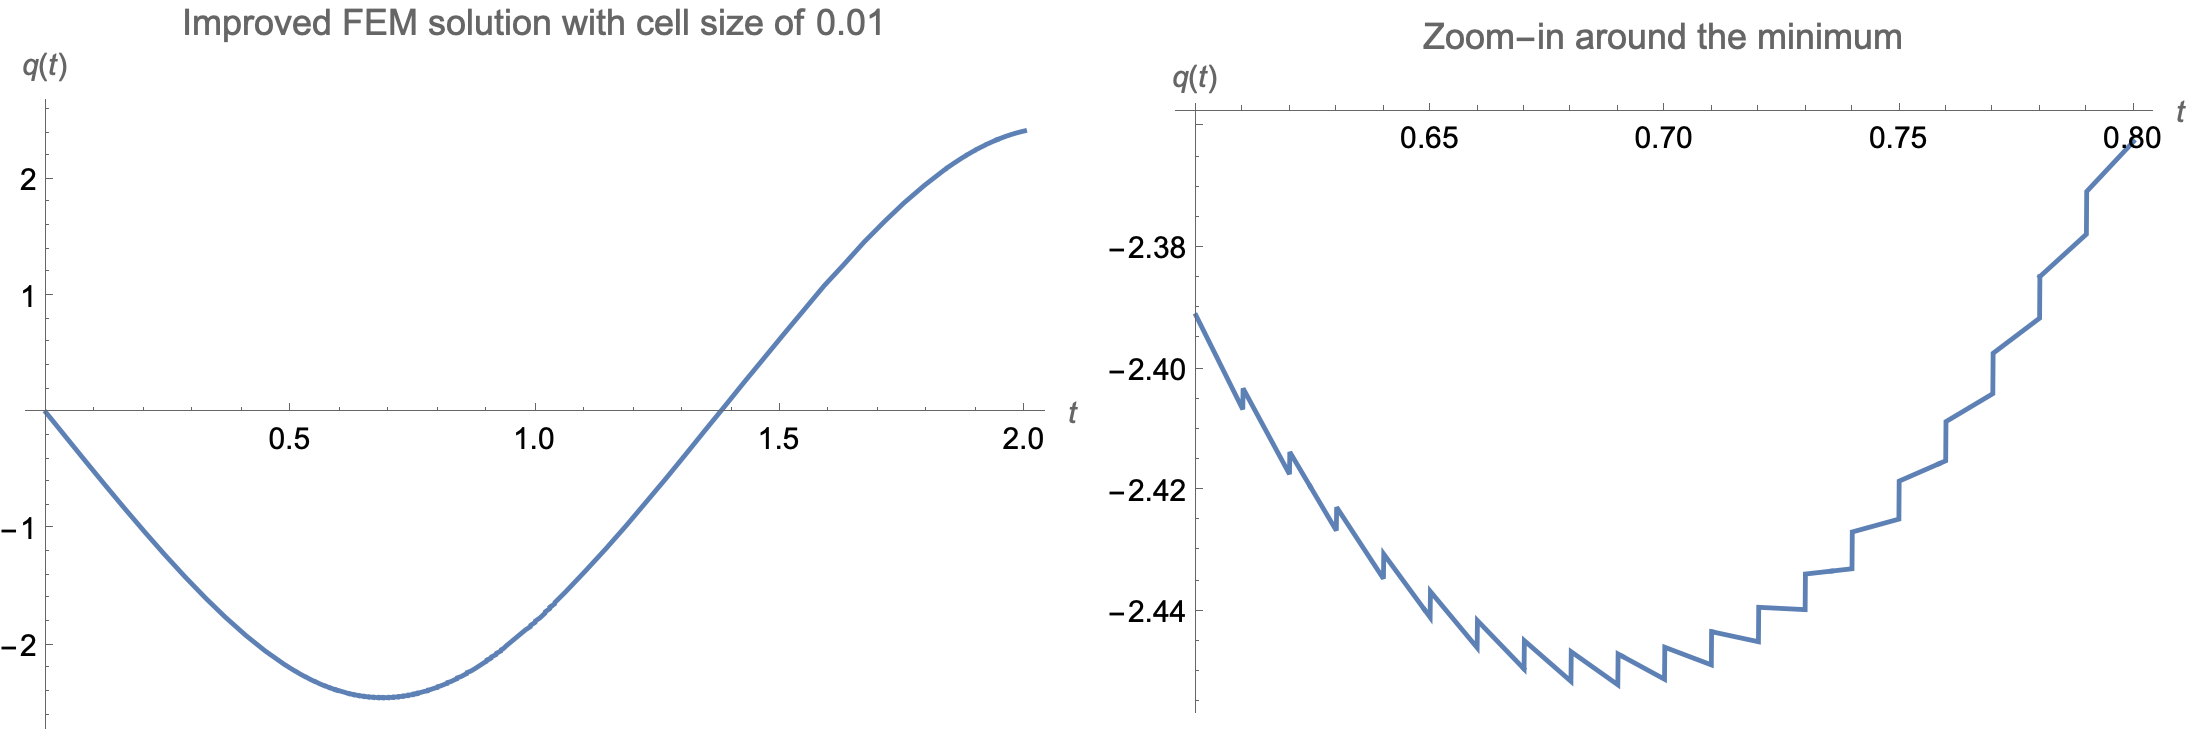
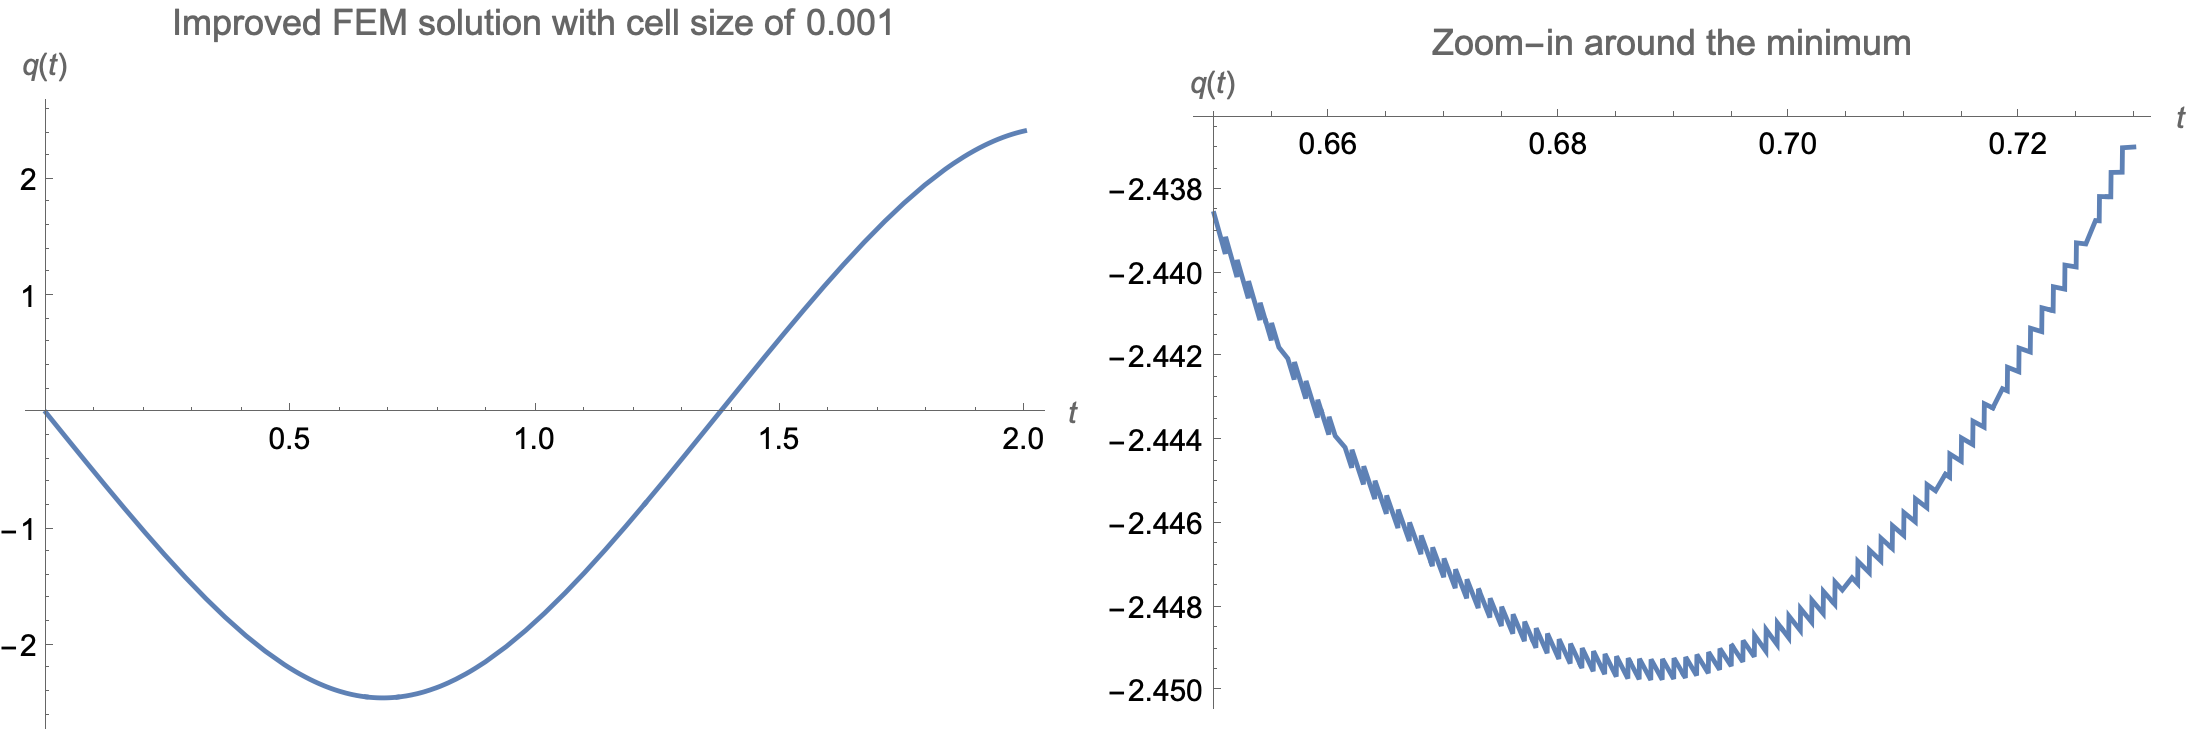
On appearance, an easy fix would have been to reduce the cell size of the FEM method. This can be achieved by setting the "MaxCellMeasure" size to something smaller (like 0.01 or 0.001 for example):
 solFEM =
 NDSolveValue[{q'[t] == ζ[t], ζ'[t] + w2*Sin[q[t]] == 0,
   DirichletCondition[{q[t] == Pi/3., ζ[t] == 0}, t == 0]},
   {q, ζ}, t ∈ Line[{{0}, {T}}],
   Method -> {"FiniteElement", "MeshOptions" -> {MaxCellMeasure -> 0.01}}]
However, this only "hides" the issue to the bare eye. One can still see the chattering effect when zooming around the minimum for example:
Why would this matter?
My problem with this issue has nothing to do with the curve appearance. On a practical level, if I want to determine, say, the local minimum (or maximum) near some region, then FindMinimum (or FindMaximum) will inevitably fail. I can easily find the local minimum near t->0.5 for the "default" solution:
FindMinimum[sol[[1]]'[t], {t, 0.5}]
(* {-2.44949, {t -> 0.688223}} *)
However, this is not possible with the FEM solution because chattering obviously affects FindMinimum:
FindMinimum[solFEM[[1]]'[t], {t, 0.5}]
••• FindMinimum: The line search decreased the step size to within the tolerance specified by AccuracyGoal and PrecisionGoal but was unable to find a sufficient decrease in the function. You may need more than MachinePrecision digits of working precision to meet these tolerances.
(* {-2.1981, {t -> 0.5}} *)
Because of chattering, this simple operation becomes impossible even when directly feeding a very close initial guess:
FindMinimum[solFEM[[1]]'[t], {t, 0.688223}]
••• FindMinimum: Line search unable to find a sufficient decrease in the function value with MachinePrecision digit precision.
(* {-2.45211, {t -> 0.69}} *)
This is only one example of the consequences of that chattering effect.


