2
$\begingroup$

I have a long list of {date,value}.

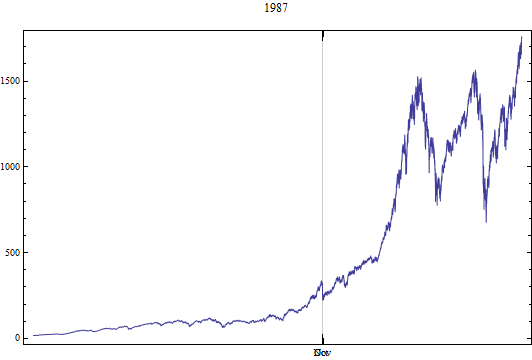
I would like to use DateListPlot to plot only a subrange, from date1 to date2, with the range on the y-axis automatically chosen to be between the min and max value between those two dates (i.e. trivial automatic zooming).

I am sure Mathematic will do it with a simple option choice, but I must be dumb and cannot find it.

Can you help?

Thanks.

PS: here is simple code to show the issue using financial data:

spx = FinancialData["SP500", All];

DateListPlot[spx, 
 PlotRange -> {{{1987, 10, 1}, {1987, 11, 30}}, Automatic}, 
 PlotLegends -> Placed[namesFrom83, {Left, Bottom}], 
 PlotLabel -> "1987"]
$\endgroup$
2
  • $\begingroup$ Probably you will be interested in How to manipulate 2D plots. $\endgroup$
    – Kuba
    Commented Oct 25, 2013 at 19:56
  • $\begingroup$ It is unclear to me what the problem is. Why not just PlotRange -> {{{1987, 10, 1}, {1987, 11, 30}}, All}? $\endgroup$ Commented Oct 26, 2013 at 0:04

2 Answers 2

2
$\begingroup$

I rather define my own filter to get new data and put it into DateListPlot:

iDateFilter[data_, st_, end_] :=
 Block[{is, ie},
  is = Position[spx, x_ /; AbsoluteTime[x[[1]]] >= AbsoluteTime[st], {1}, 1, 
     Heads -> False];
  ie = Position[spx, x_ /; AbsoluteTime[end] <= AbsoluteTime[x[[1]]], {1}, 1, 
    Heads -> False];
  Take[data, Flatten[{is, ie}]]
 ]

DateListPlot[iDateFilter[spx, {1987, 10, 1}, {1987, 11, 30}], 
 PlotLabel -> "1987"]
$\endgroup$
1
$\begingroup$

Using spx as defined:

With[{min = Min[spx[[;; , 2]]], max = Max[spx[[;; , 2]]]},
 DateListPlot[spx, 
  PlotRange -> {{{1987, 10, 1}, {1987, 11, 30}}, {0.9 min, 1, 1 max}},
   PlotLabel -> "1987", Joined -> True]]   

(omitting label):

Care may be needed if other datasets have missing values.

enter image description here

$\endgroup$
2
  • 1
    $\begingroup$ so you are telling me there is no simple option to tell Mathematica to do it? I am amazed, it is such a basic plotting functionality! $\endgroup$
    – ac1965
    Commented Oct 26, 2013 at 13:28
  • $\begingroup$ by the way, from the picture attached it seems that the second solution does not work: it is plotting the whole date range, not those 2 months in 1987 (look at the values on the y axis and you will see it immediately) $\endgroup$
    – ac1965
    Commented Oct 26, 2013 at 13:30

Your Answer

By clicking “Post Your Answer”, you agree to our terms of service and acknowledge you have read our privacy policy.

Not the answer you're looking for? Browse other questions tagged or ask your own question.